 TB
TB DAL
DAL PHI
PHI JAX
JAX CHI
CHI GB
GB CIN
CIN MIA
MIA CLE
CLE NYJ
NYJ HOU
HOU TEN
TEN IND
IND PIT
PIT LV
LV NE
NE MIN
MIN NO
NO NYG
NYG WAS
WAS DEN
DEN LAC
LAC SF
SF SEA
SEA BAL
BAL ATL
ATL BUF
BUF LA
LA

This looks like a close contest, but we give a slight edge to DET.
Matchups to watch
How each player gets his production, set against how this opponent has defended it over their last 17 games. After the game we grade who won each one.
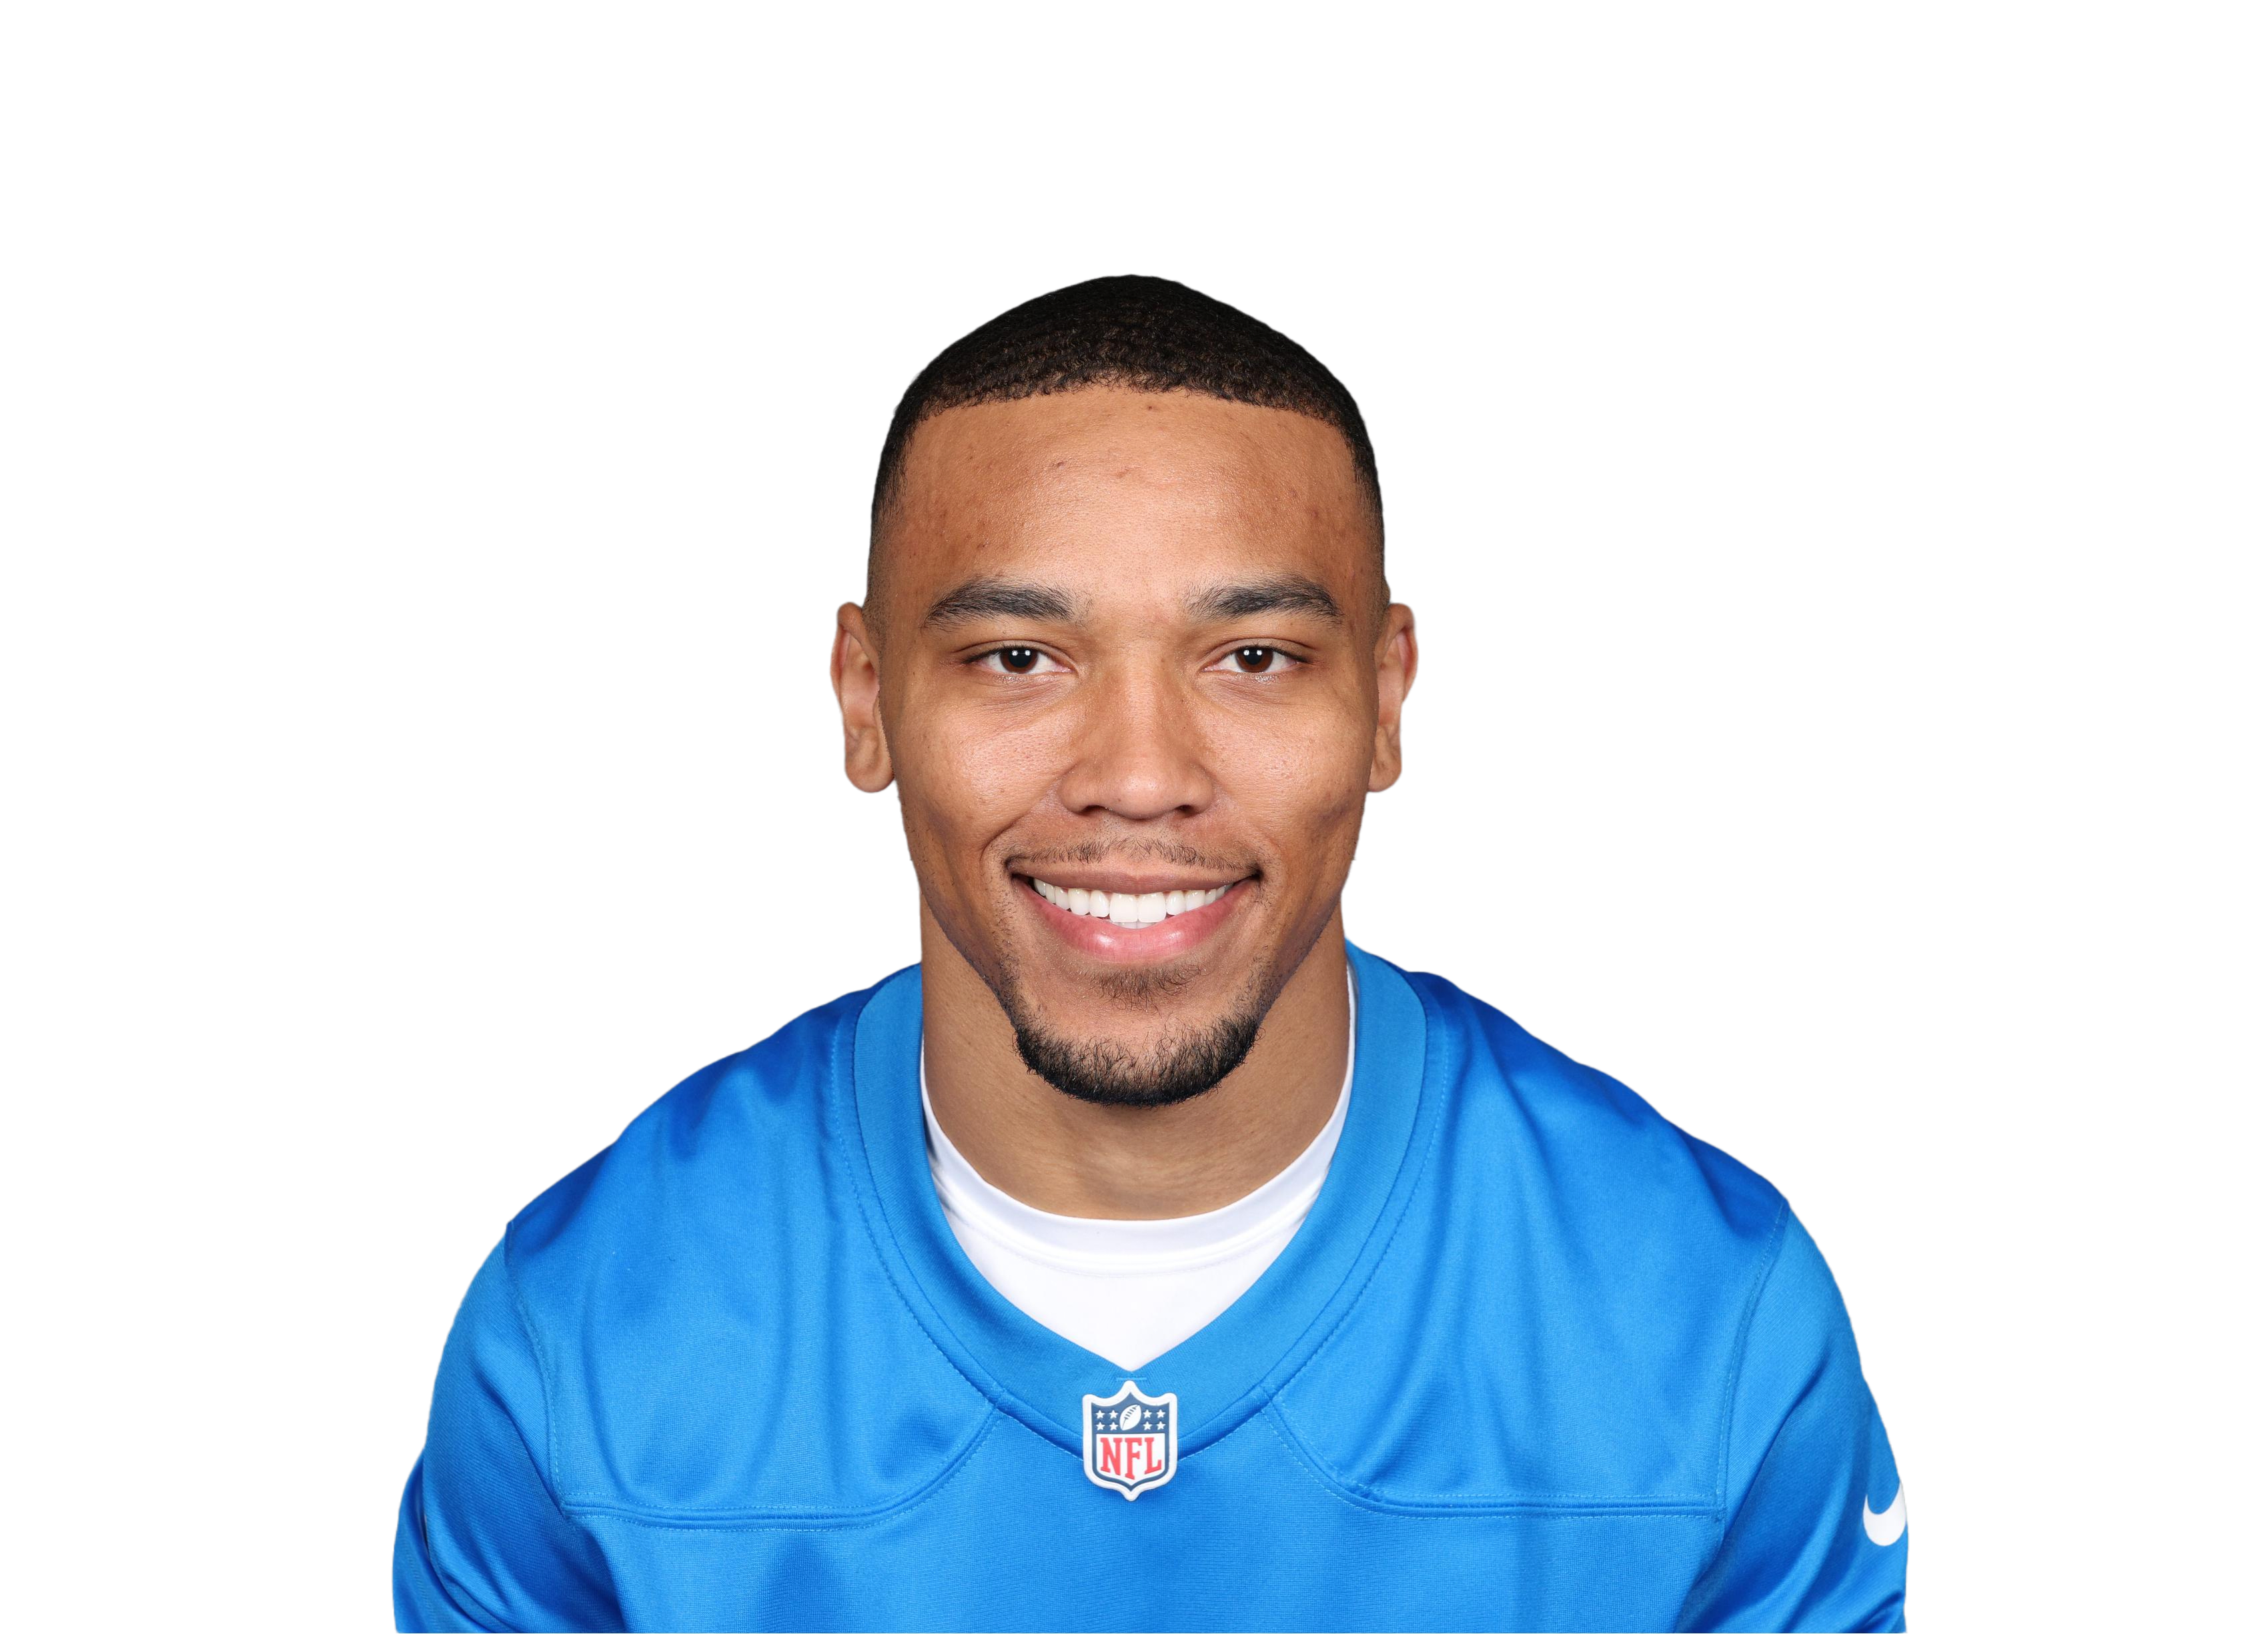
Where his targets come from
Share of his targets. The white tick is the league average.
How ARI defend it
Ranked of 32, last 17 games. Green is a weakness to attack.
- Arizona rank 30th against short throws, which make up 66% of Brown's targets.
- Work the middle: 31% of his targets go that way and Arizona rank 30th defending throws there.
- Free data doesn't show who covers whom on each snap, so this is the defence's profile, not a confirmed one-on-one.
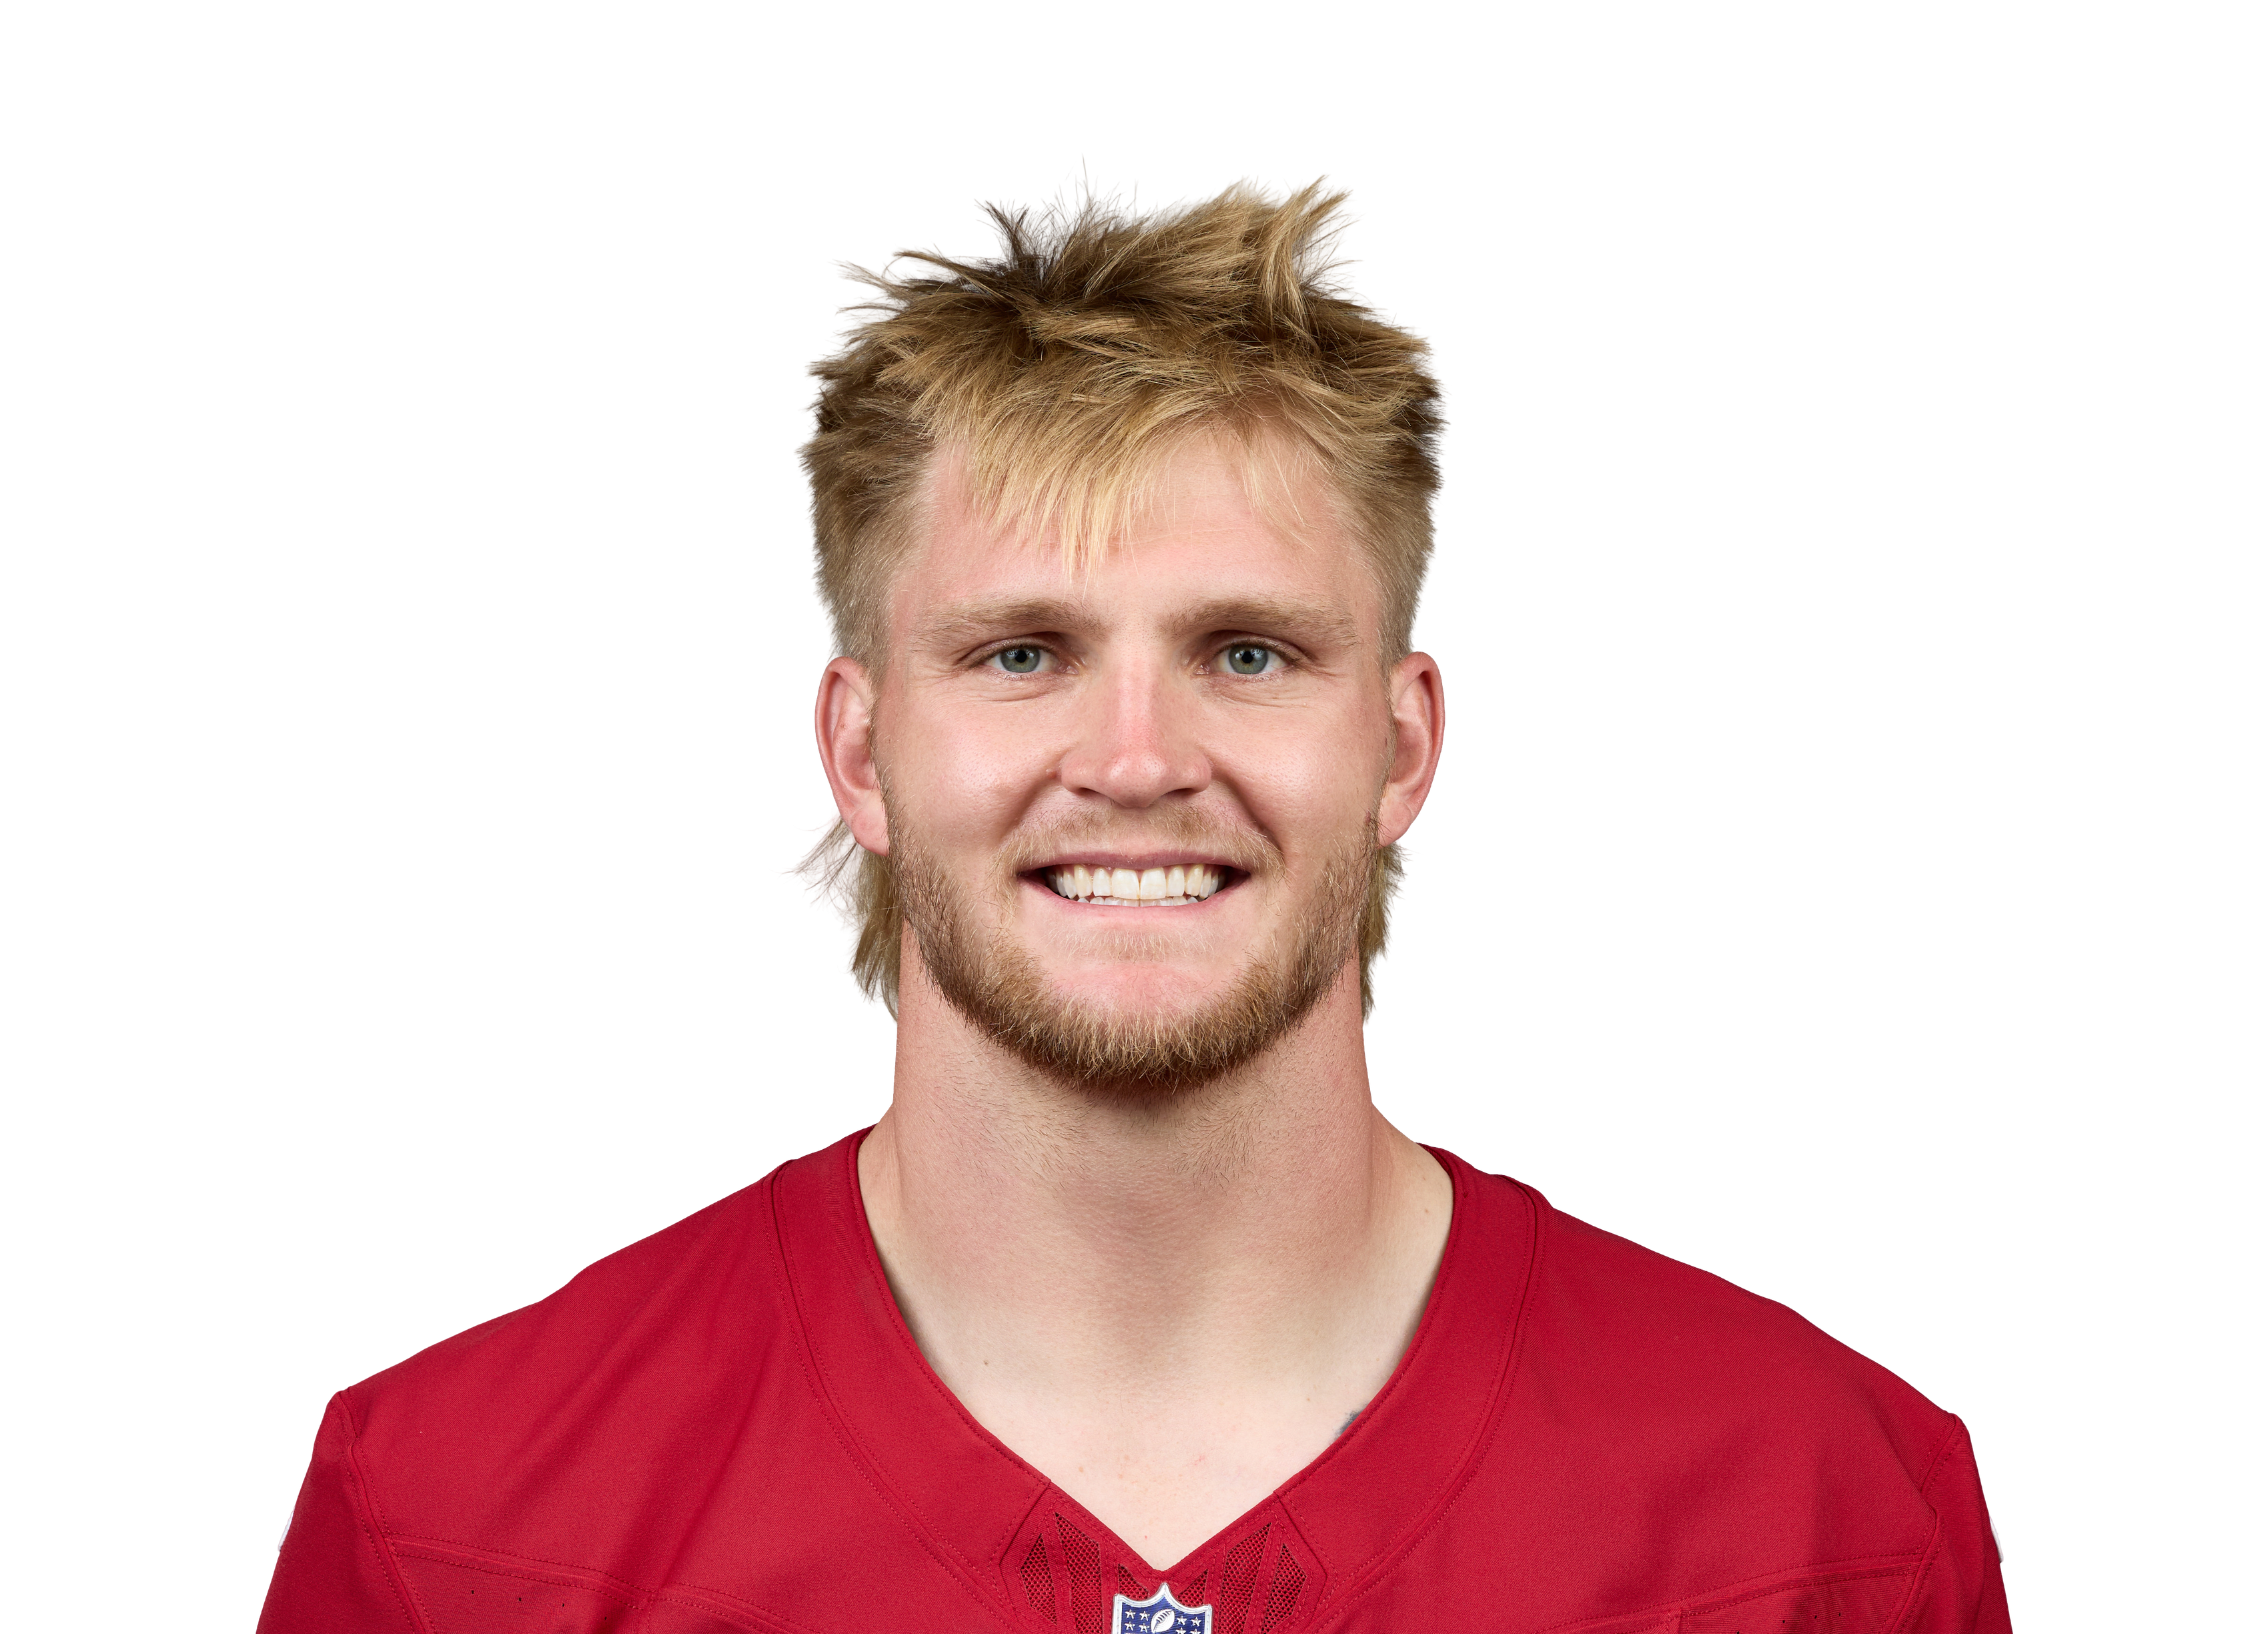
Where his targets come from
Share of his targets. The white tick is the league average.
How DET defend it
Ranked of 32, last 17 games. Green is a weakness to attack.
- Detroit rank 29th against deep balls, and 5% of McBride's targets travel 20+ yards (the average TE is at 6%).
- Work the right side: 46% of his targets go that way and Detroit rank 27th defending throws there.
- Contested catches aren't his edge this week: he's 17th percentile for separation and 77th for hands, and Rock Ya-Sin and Terrion Arnold both allow fewer yards per target than the average corner (7.4).
- Free data doesn't show who covers whom on each snap, so this is the defence's profile, not a confirmed one-on-one.
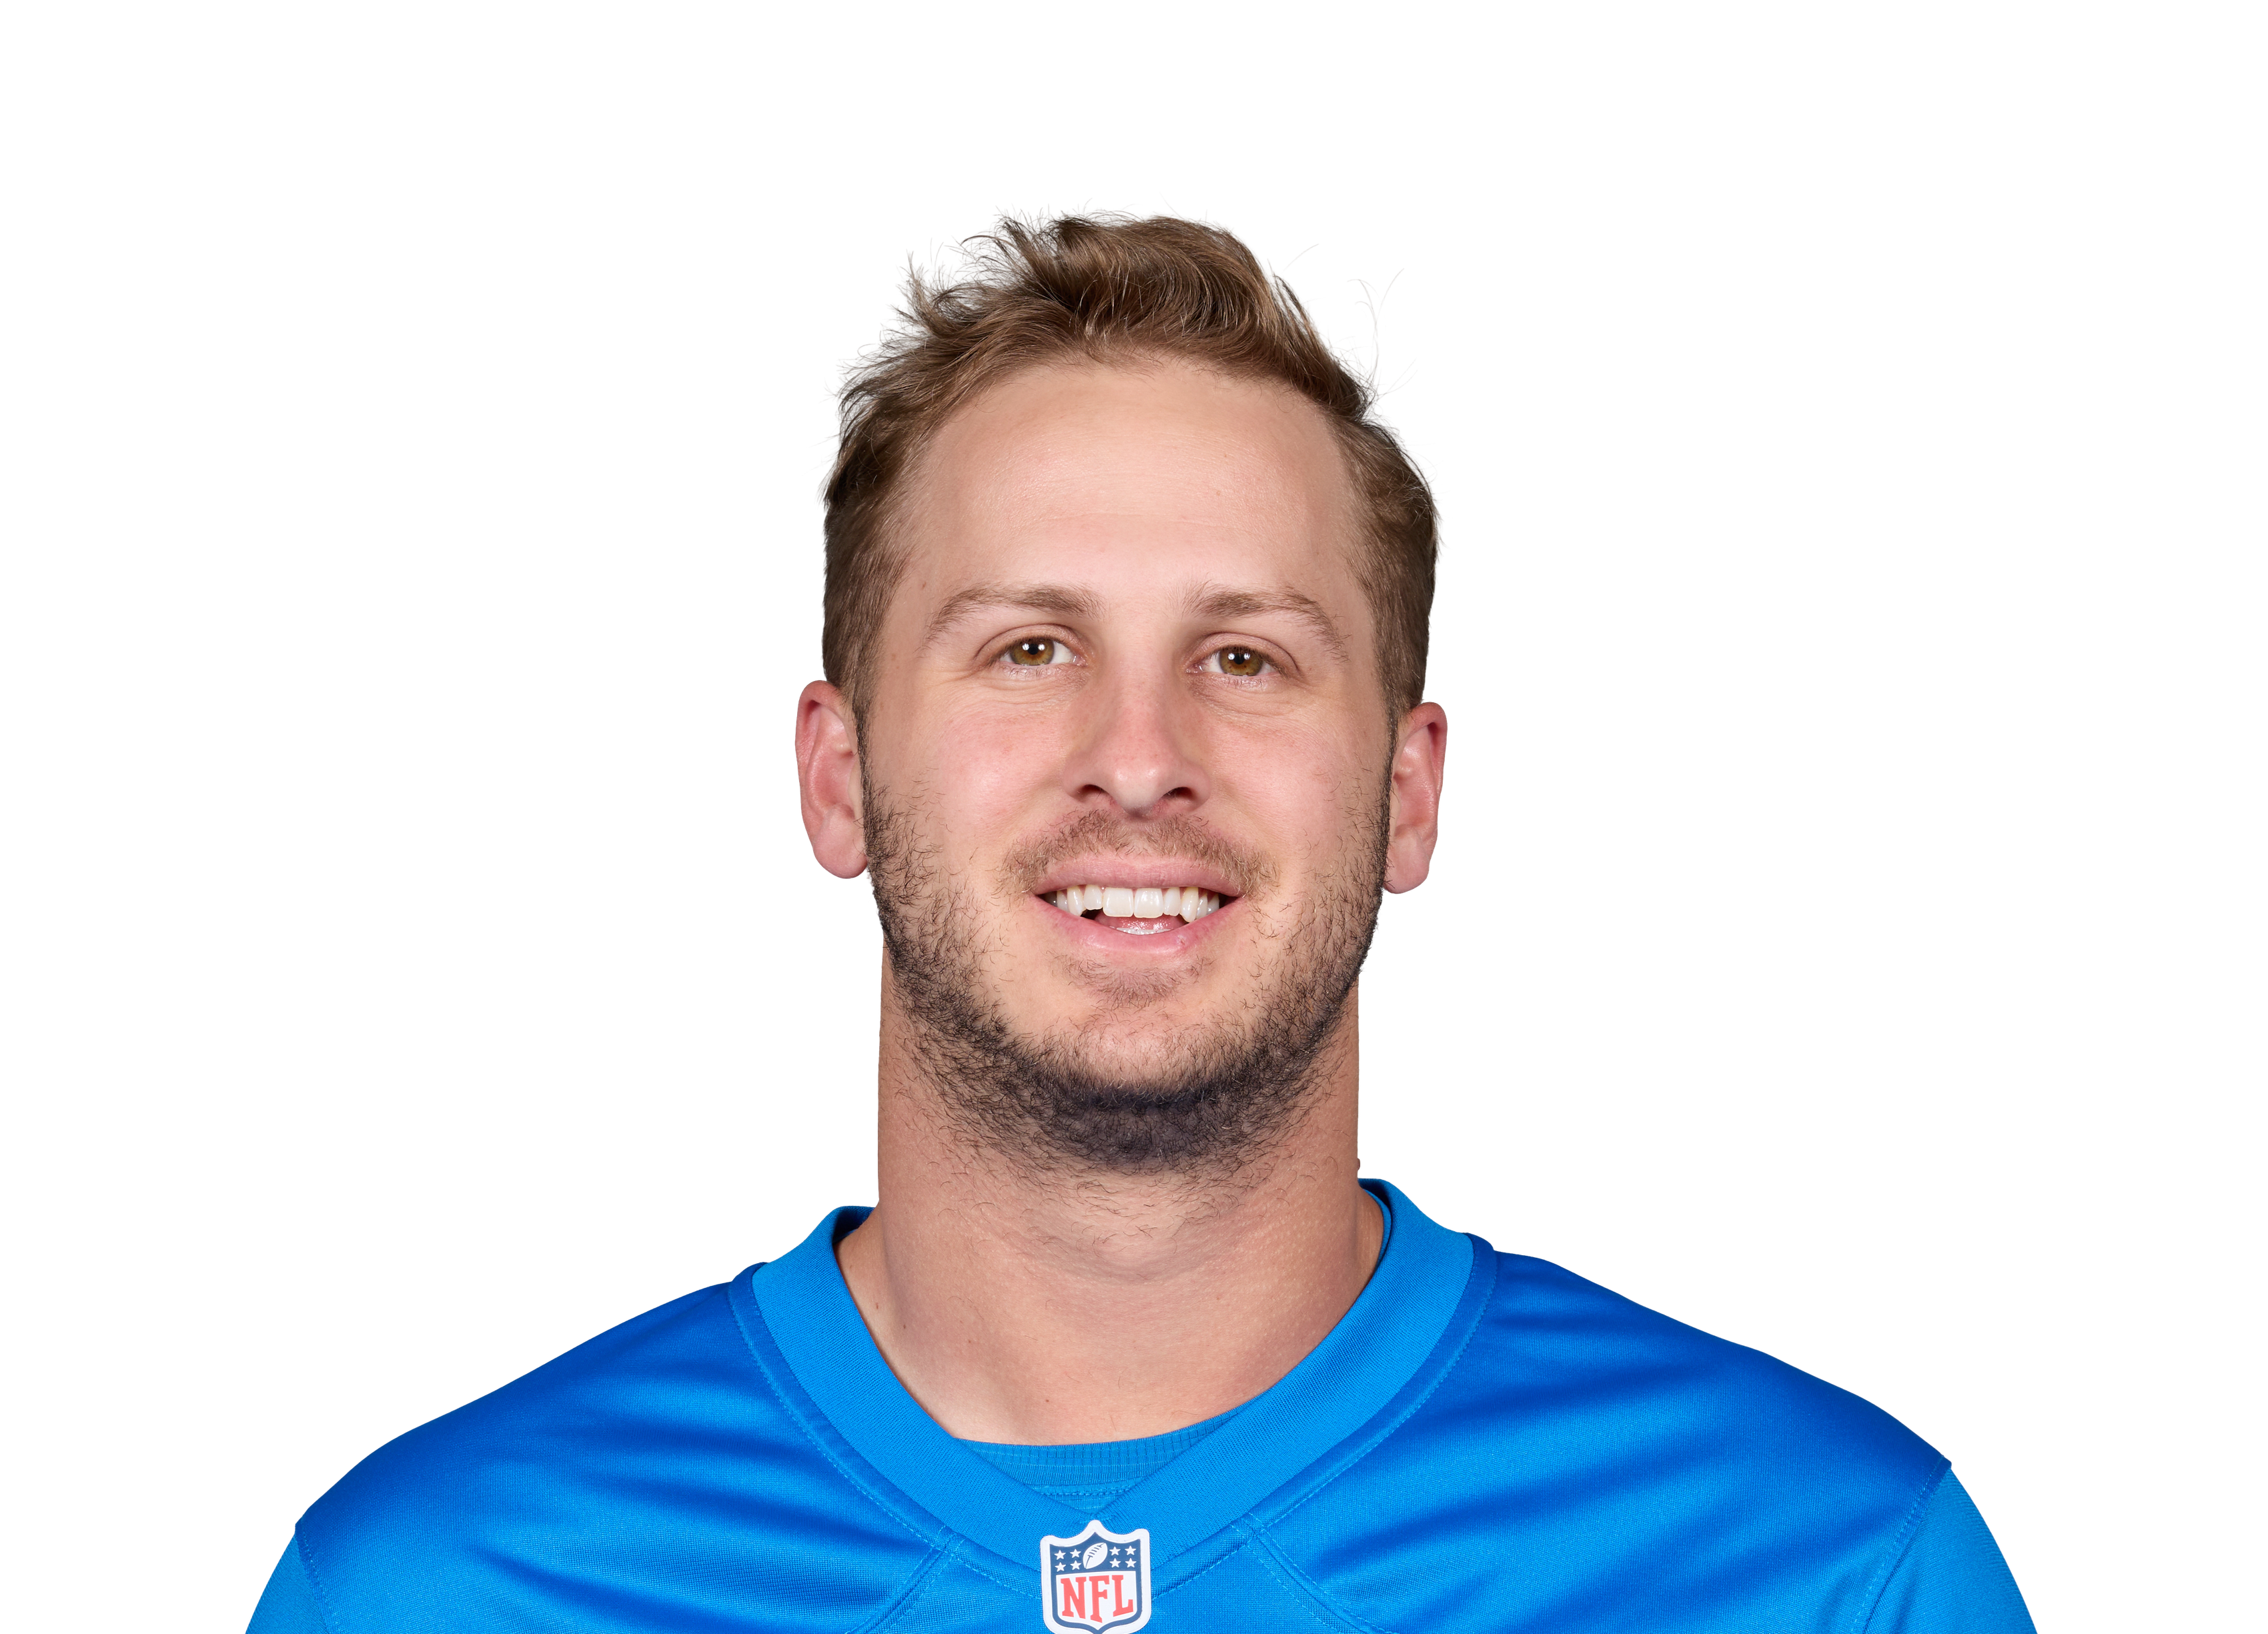
How ARI defend it
Ranked of 32, last 17 games. Green is a weakness to attack.
- Arizona rank 30th in EPA per dropback allowed over their last 17 games, and 30th against short throws.
- Pressure: Arizona are 26th at getting sacks, and Detroit are 14th at avoiding them.
Unit by unit
Each unit ranked against all 32 teams on 2026 play-by-play through week 4. Longer bar is better; a gold rank marks the side with the edge.
When the Lions have the balloffence against defence, rank of 32 (1st is best)DET offenceARI defenceBiggest gap: passing, where the Lions offence has a 25-place edge.
When the Cardinals have the balloffence against defence, rank of 32 (1st is best)ARI offenceDET defenceBiggest gap: third down, where the Cardinals offence has a 18-place edge.
Only 4 weeks of data so far: treat ranks as a direction, not a verdict.
Form and history
Lions this season Cardinals this season20-13DET at ARI
2024-09
12-30ARI at DET2021-12
Injury report
Lionsmodel impact 0.0| Kendrick LawWR · Knee - ACL | IR |
| Isiah PachecoRB · Back | IR |
| Avonte MaddoxCB · Foot | IR |
| Payton TurnerDE · Back | IR |
| Damone ClarkLB | IR |
| Cade MaysOL · Wrist | IR |
| Giovanni ManuOL · Knee | PUP |
| Brian BranchDB · Achilles | PUP |
| Kerby JosephDB · Knee | PUP |
| Thomas HarperDB · Ankle | IR |
| Rock Ya-SinCB · Hamstring | Doubtful |
| Ben BartchOL · Foot | Questionable |
Cardinalsmodel impact 0.0| Trey BensonRB · Knee | IR |
| James ConnerRB · Foot | IR |
| Hunter LongTE · Knee | IR |
| Tip ReimanTE · Ankle | PUP |
| Jameson GeersTE | IR |
| Kaleb ProctorDT · Knee - Meniscus | IR |
| Paris JohnsonOL · Biceps | IR |
| Will JohnsonDB · Neck | IR |
| Chase BisontisG · Knee - MCL | IR |
| Zach CarterDL · Knee | IR |
| Joey BlountDB | IR |
| Kitan CrawfordDB · Ankle | IR |
Player props
Every posted line with the market's view and each player's last ten games against it.
Player props for this game haven't been posted by the books yet. They usually land Thursday to Saturday.
The betting view
Posted odds, the same odds with the bookmaker's margin removed, and where the model disagrees.
Read this before you bet: picking winners is not beating the price. At posted odds our 2025 flat-bet ROI was −6.9%. Use the model as one view of the game, not a tip.
What the model sees
Model favors DET (69%) by 6.4 points.