 SEA
 DEN
 HOU
 JAX
 BAL
 CAR
 PHI
 CHI
 ATL
 NO
 NYG
 NYJ
 NE
 TEN
 ARI
 LA
 BUF
 LV
 LAC
 KC
 DAL
 GB
 WAS
 SF

Pittsburgh, every week
A deep dive after every game, a preview before it, and on a short week one piece: what went wrong and what to fix for the next opponent.

Who's playing well


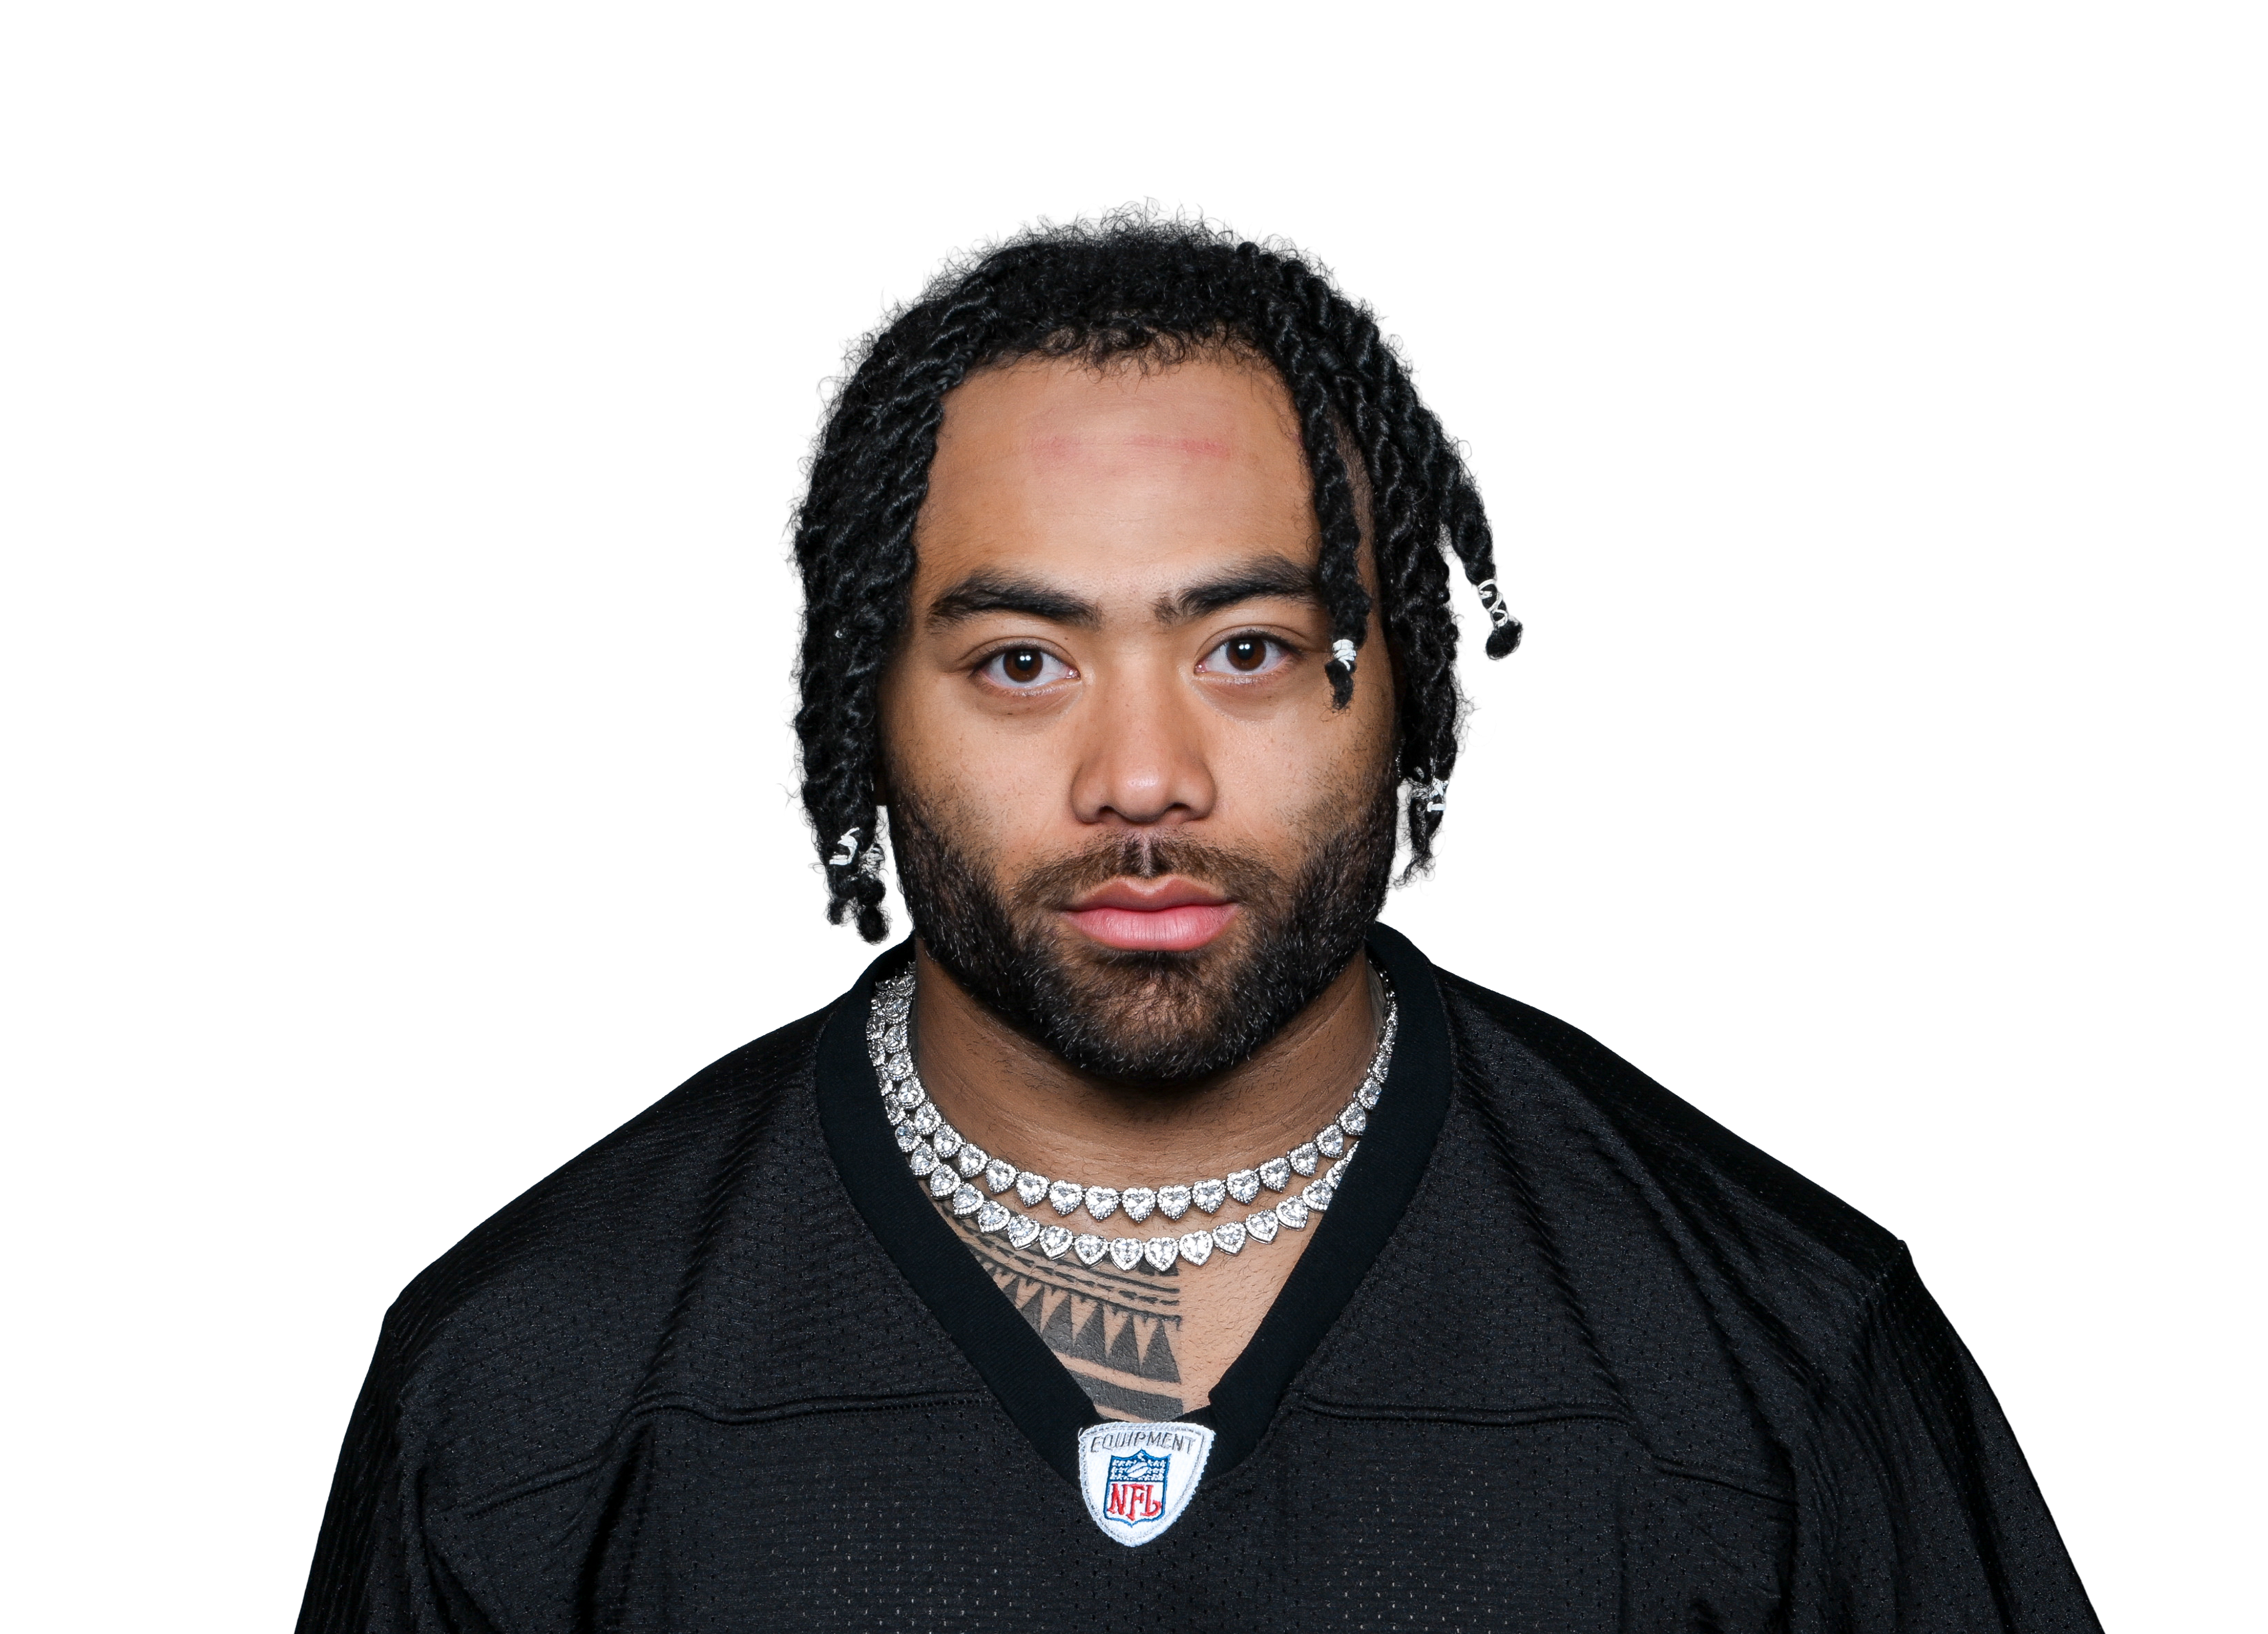
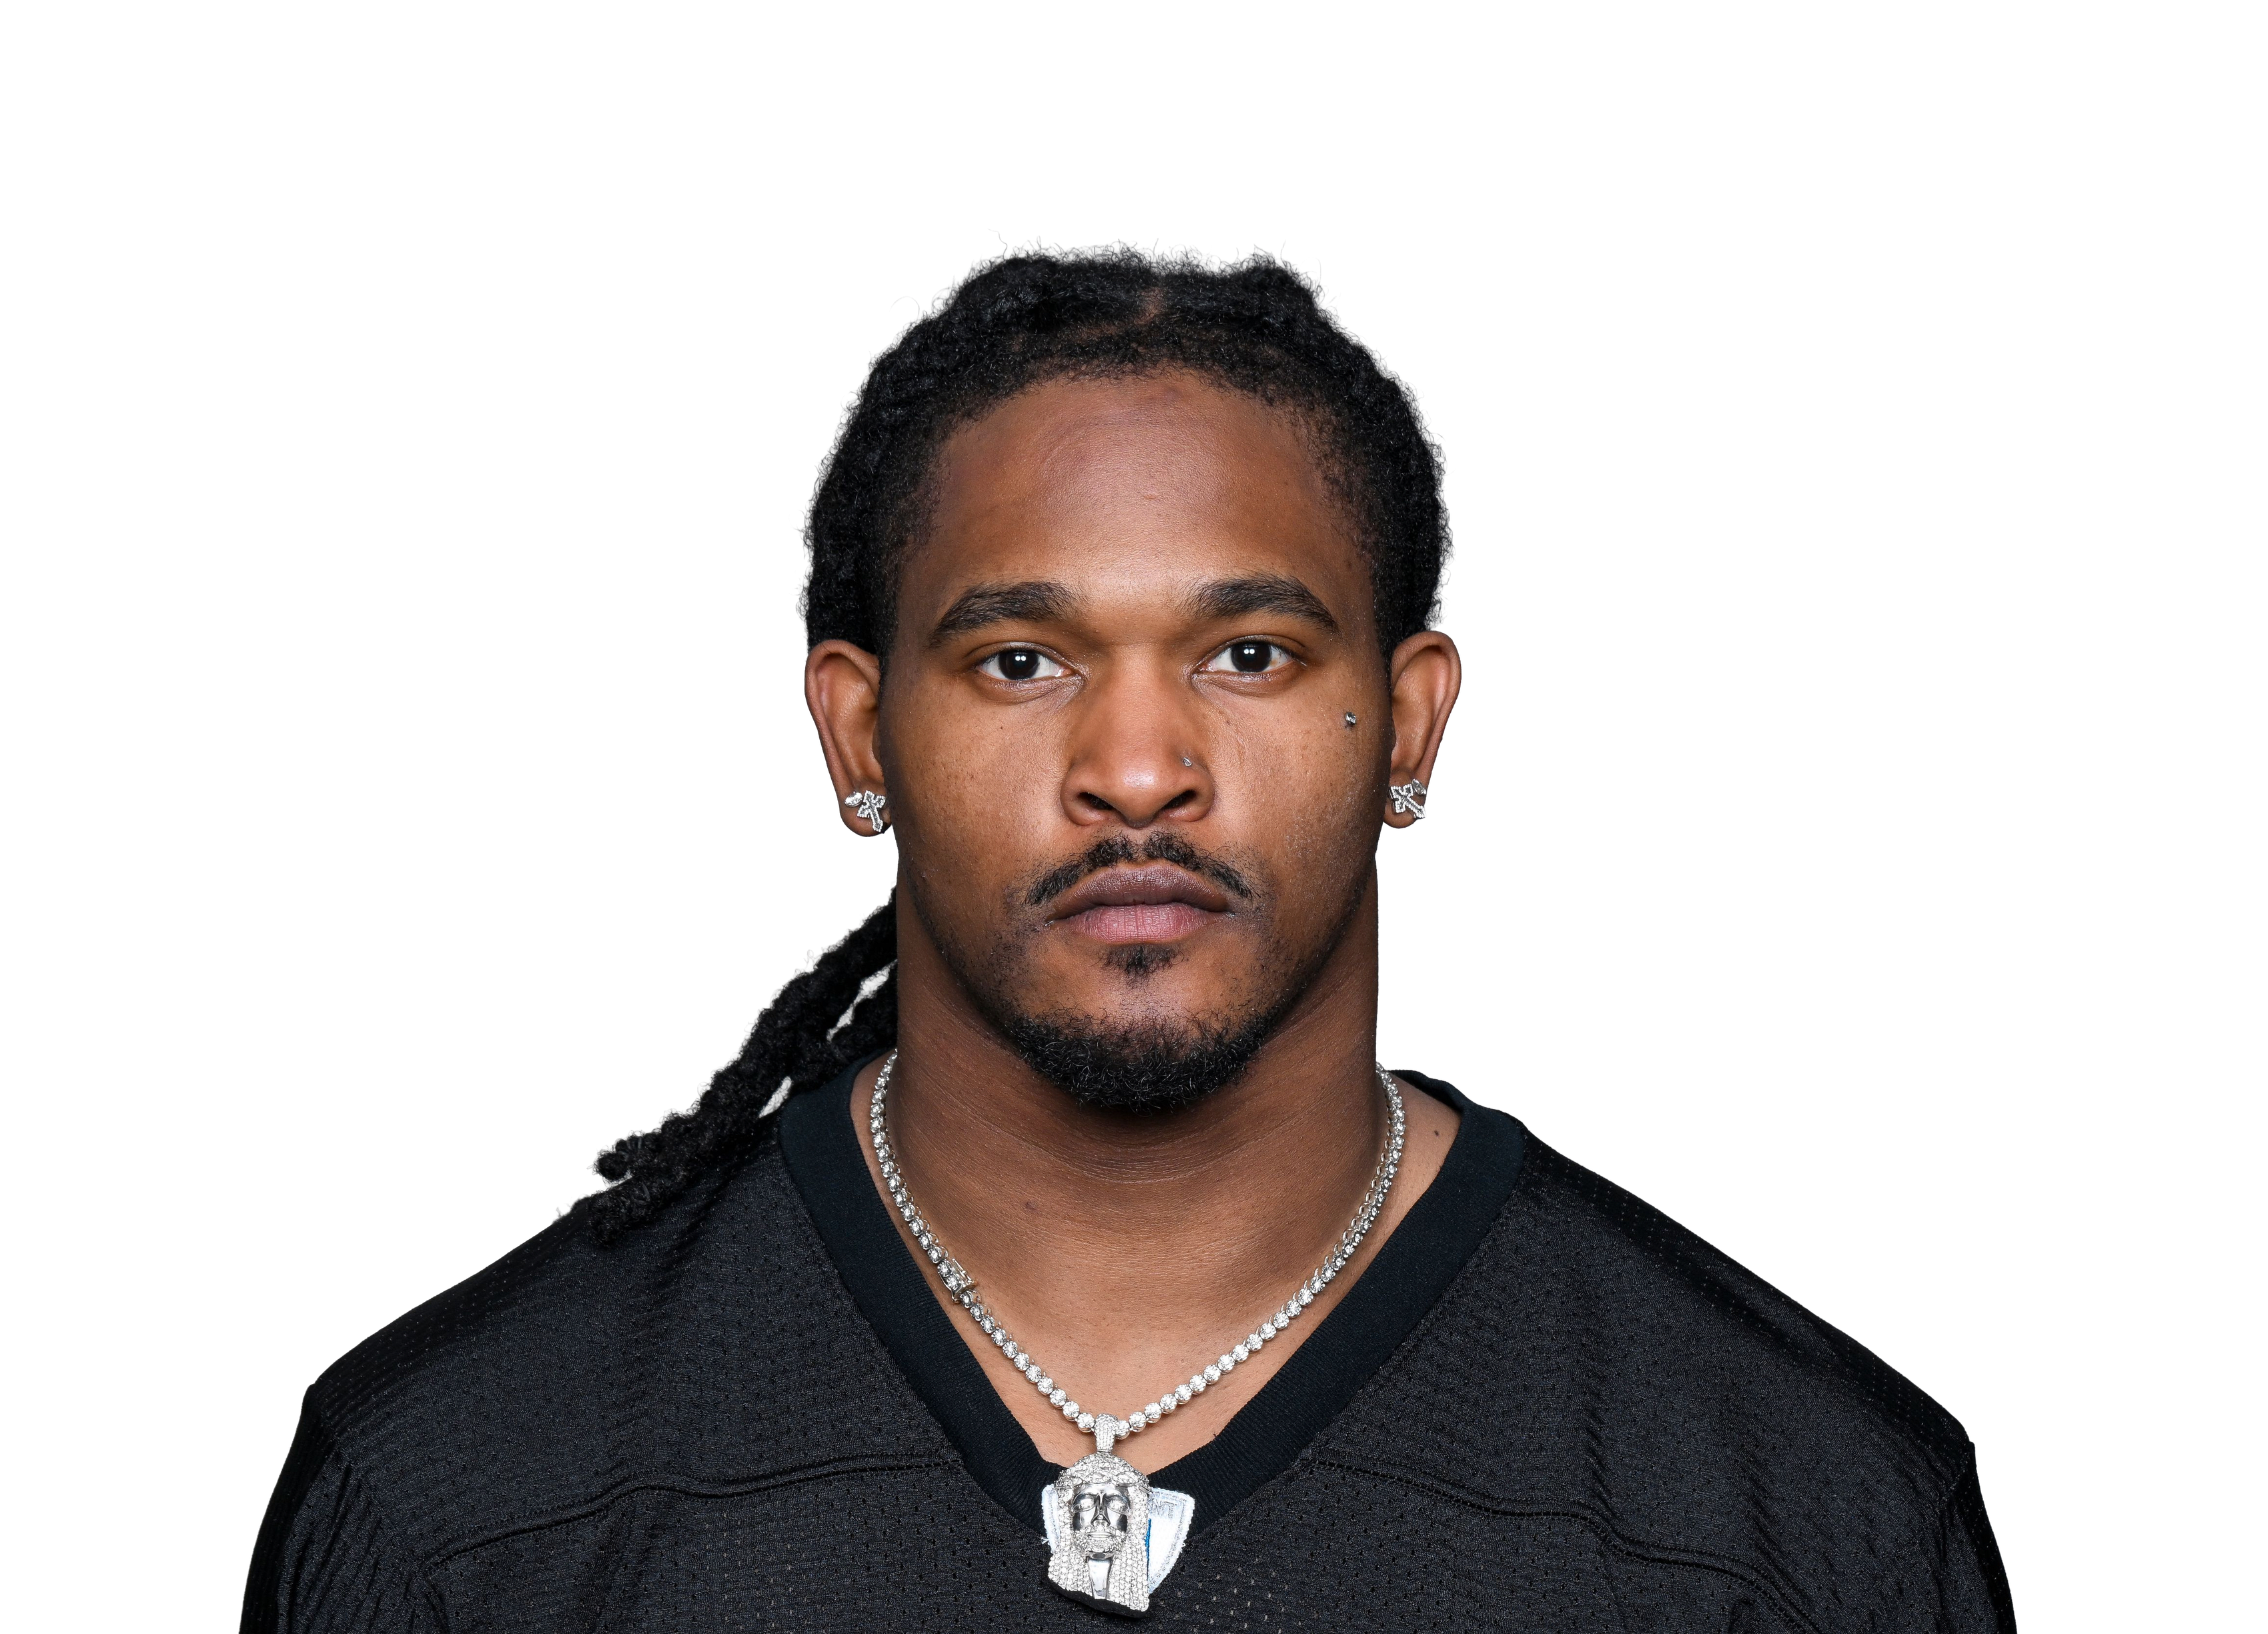



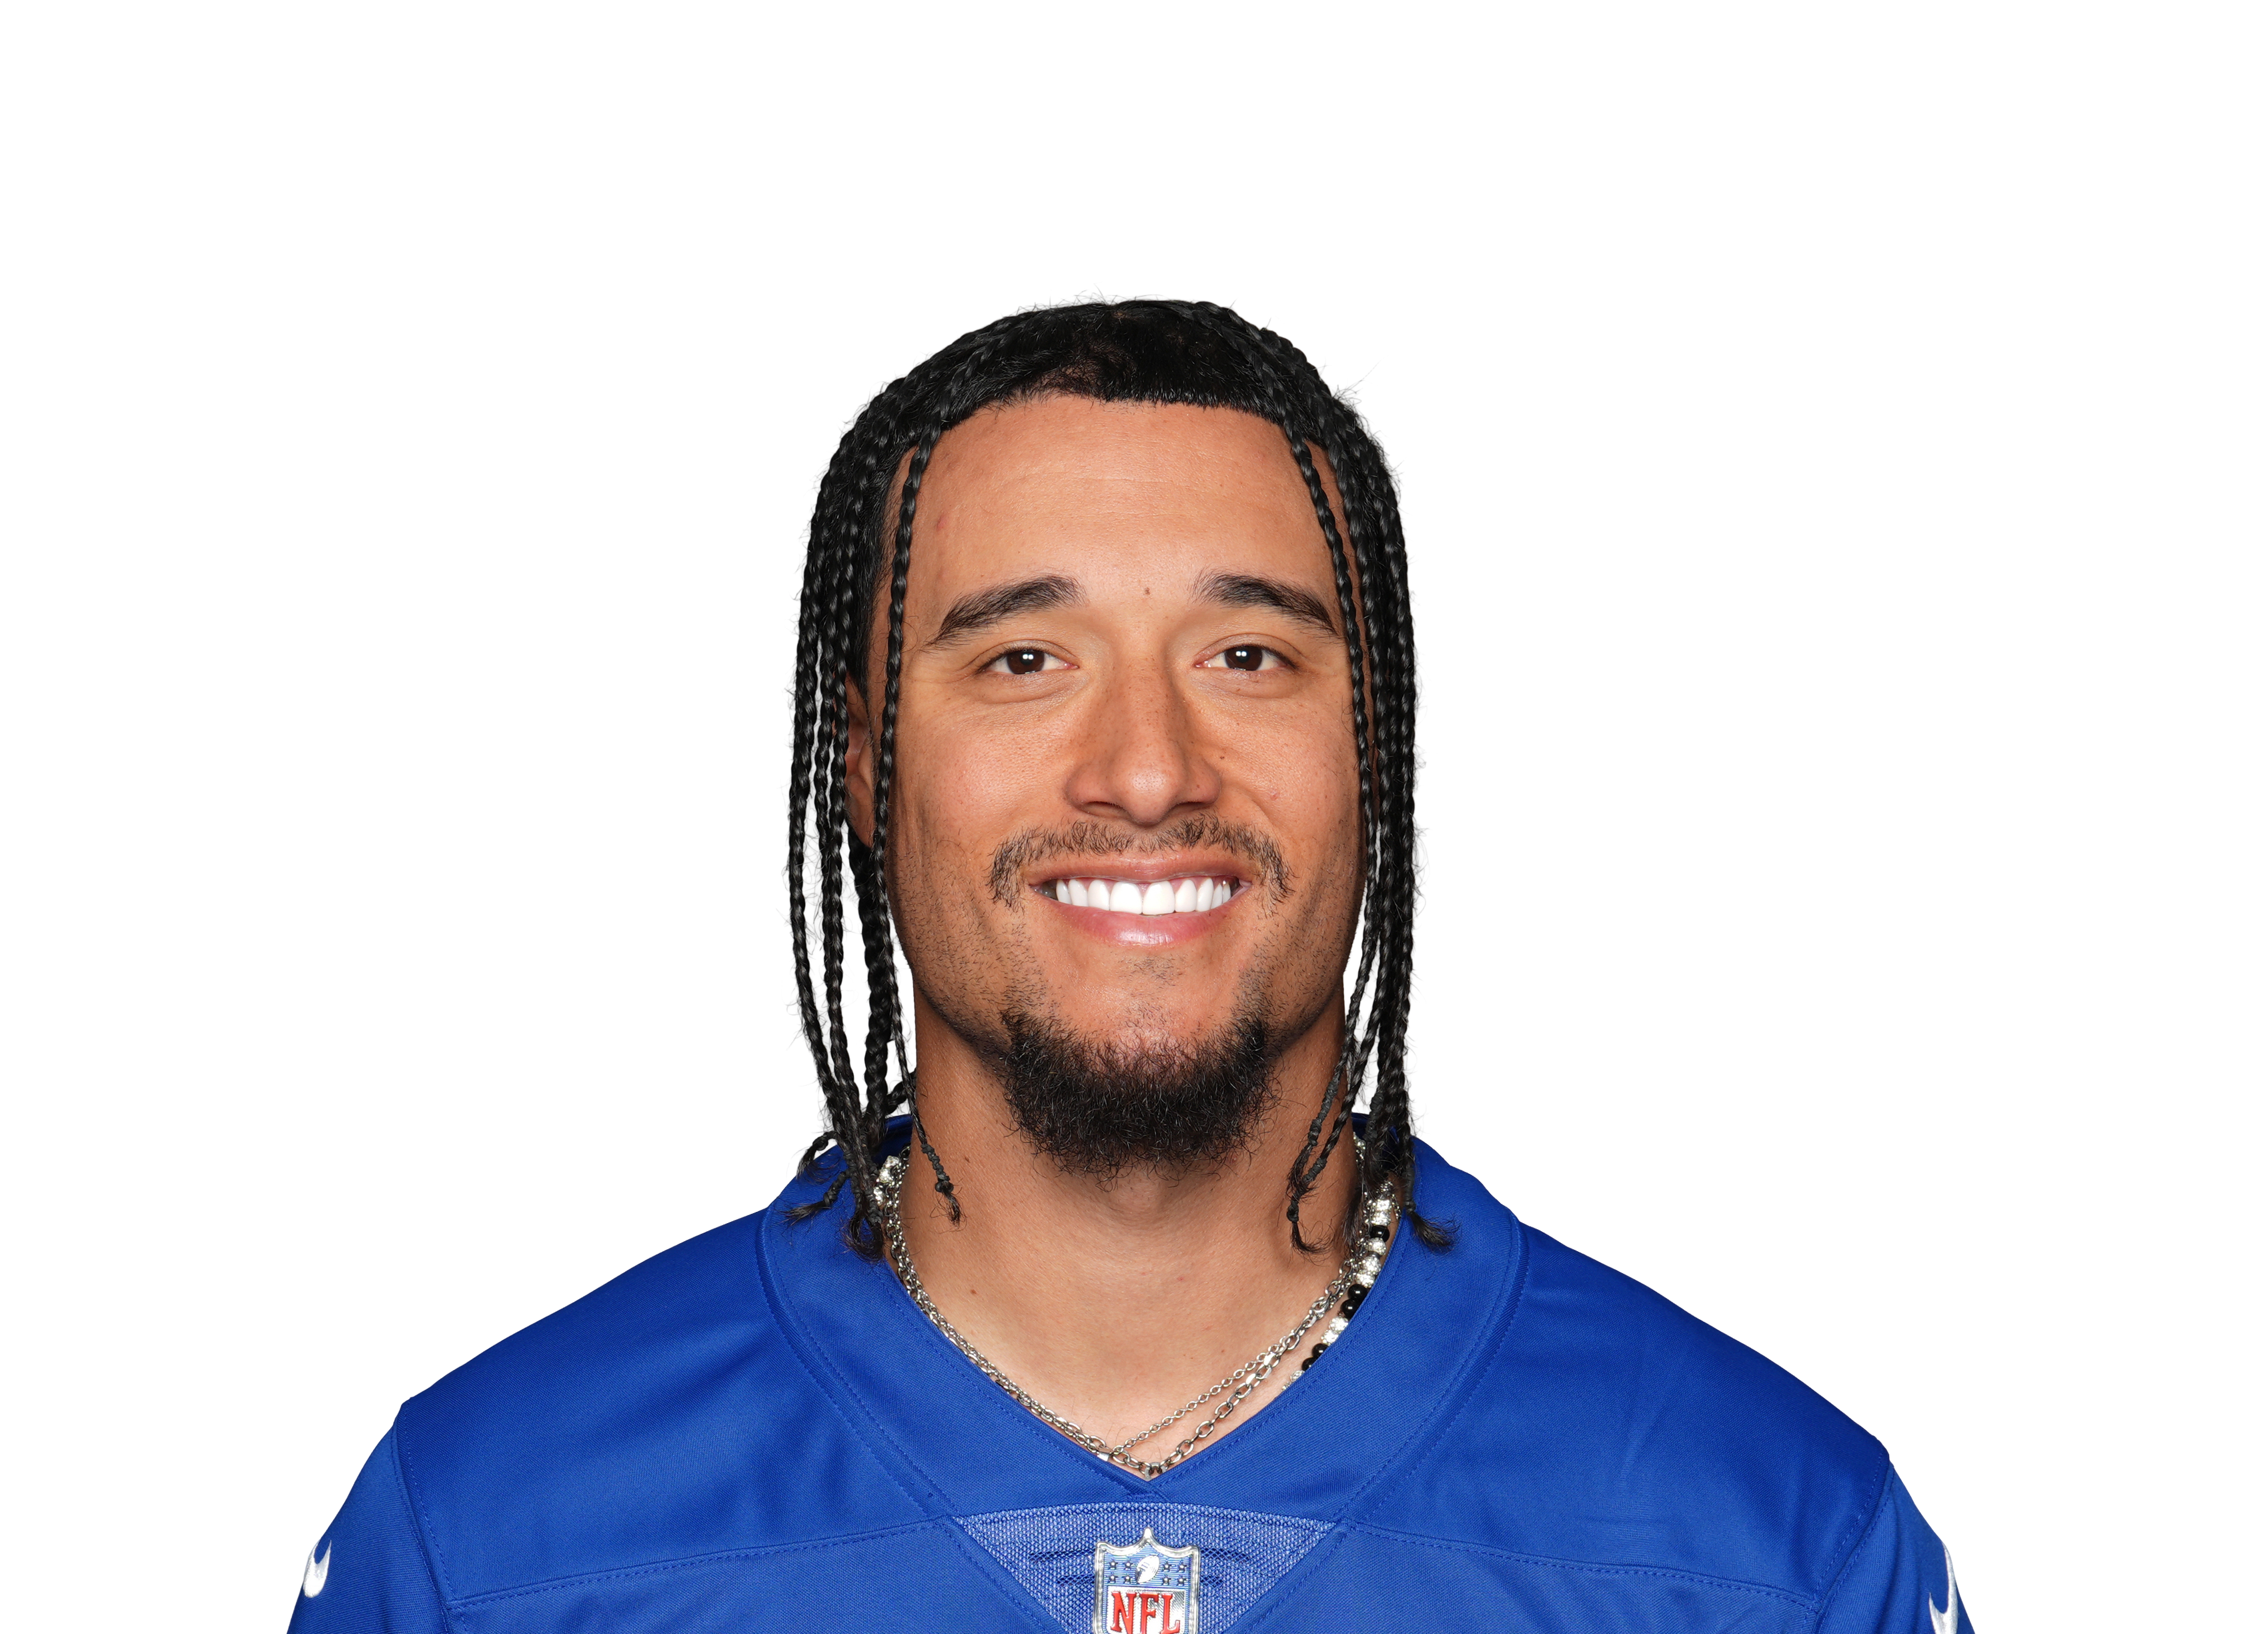

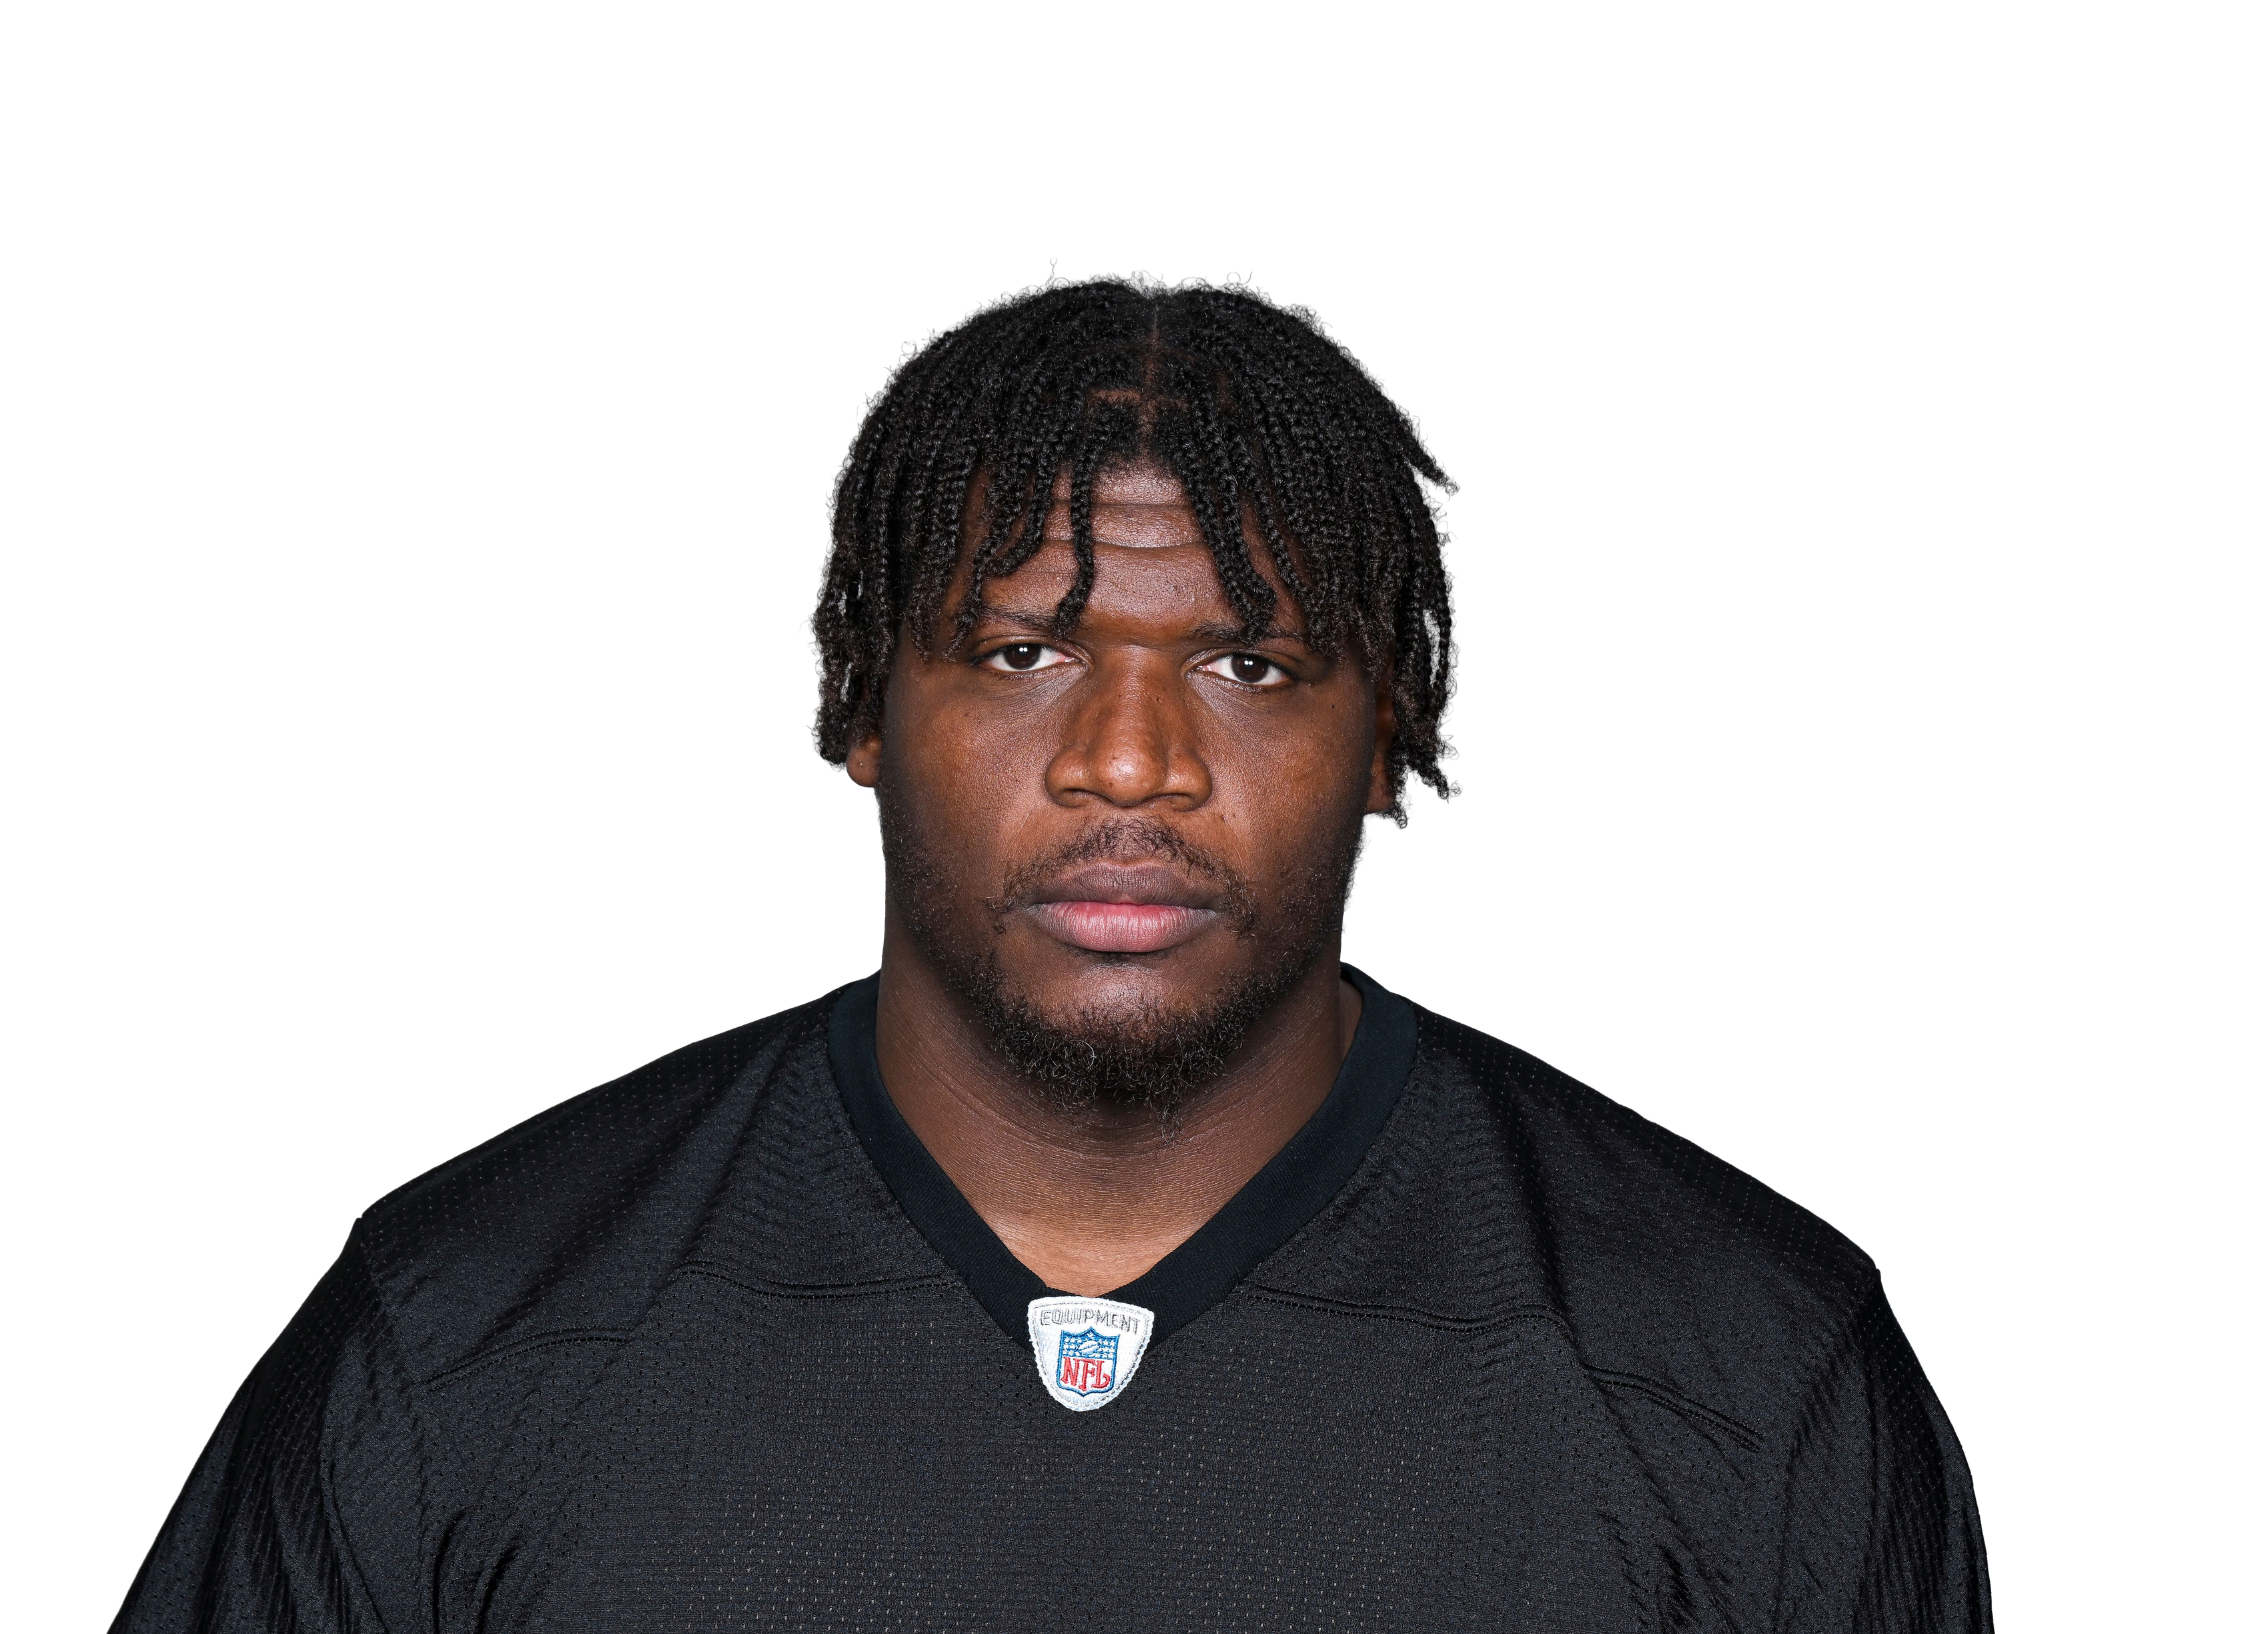
 T.J. WattLB · 97 established91
 Alex HighsmithLB · 88 established90
 Nick HerbigLB · 87 established78
 Sebastian Joseph-DayDL · 54 established65
 KJ HenryDL61
 Cameron HeywardDL · 88 established90
 Keeanu BentonDL · 78 established87
 Derrick HarmonDL73
 Yahya BlackDL46
 Payton WilsonLB · 80 established93
 Cole HolcombLB · 50 established52
 Patrick QueenLB · 55 established42
 Jamel DeanDB · 78 established91
 Terell SmithDB70
 Sean Murphy-BuntingDB · 54 established58
 Brandin EcholsDB · 65 established56
 Jalen RamseyDB · 57 established48
 Asante Samuel Jr.DB · 46 established46
 DeShon ElliottDB · 83 established91
 Rayshawn JenkinsDB · 81 established63
 Jaquan BriskerDB · 72 established59
Where the season lands
Played games fixed at their real results, the rest simulated with the model. Re-run every Tuesday; this run is through week 5.
Final win total, share of simulations. Gold is the most likely.
Steelers breakdowns
Pittsburgh win 34‑22: the red zone was clinical, but the offence stalled
Week 5, vs Indianapolis. Red-zone TD rate ranked 1st of 30 this week; success rate ranked 17th. Here's what the data says happened.

Pittsburgh 34, Indianapolis 22: how it played out
We had Pittsburgh at 50%. The market had Pittsburgh by 3. Pittsburgh won 34-22 at Acrisure Stadium.
Pittsburgh at home to Indianapolis: the model leans PIT
IND at PIT, Sunday 1:00pm ET. Model PIT 51%, market PIT 56%.
Pittsburgh 27‑24 loss: the offence stalled
Week 4, at Cleveland. Explosive-play rate ranked 1st of 2 this week; EPA per play ranked 2nd. Here's what the data says happened.

Cleveland 27, Pittsburgh 24: our lean held, the market's didn't
We had Cleveland at 53%. The market had Pittsburgh by 2.5. Cleveland won 27-24 at Huntington Bank Field.
Pittsburgh win 30‑27: the offence moved the ball, but the defence got pushed around
Week 3, vs Cincinnati. Explosive-play rate ranked 3rd of 32 this week; EPA per play allowed ranked 30th. Here's what the data says happened.
