 CAR
 GB
 ARI
 DAL
 ATL
 TB
 BAL
 CLE
 PIT
 IND
 JAX
 MIN
 DET
 TEN
 CIN
 DEN
 PHI
 WAS
 CHI
 SEA


This looks like a close contest, but we give a slight edge to NYJ. LV have struggled recently, losing 4 of their last 5. NYJ have been struggling, dropping 4 of their last 5.
Matchups to watch
How each player gets his production, set against how this opponent has defended it over their last 17 games. After the game we grade who won each one.

Where his targets come from
Share of his targets. The white tick is the league average.
How NYJ defend it
Ranked of 32, last 17 games. Green is a weakness to attack.
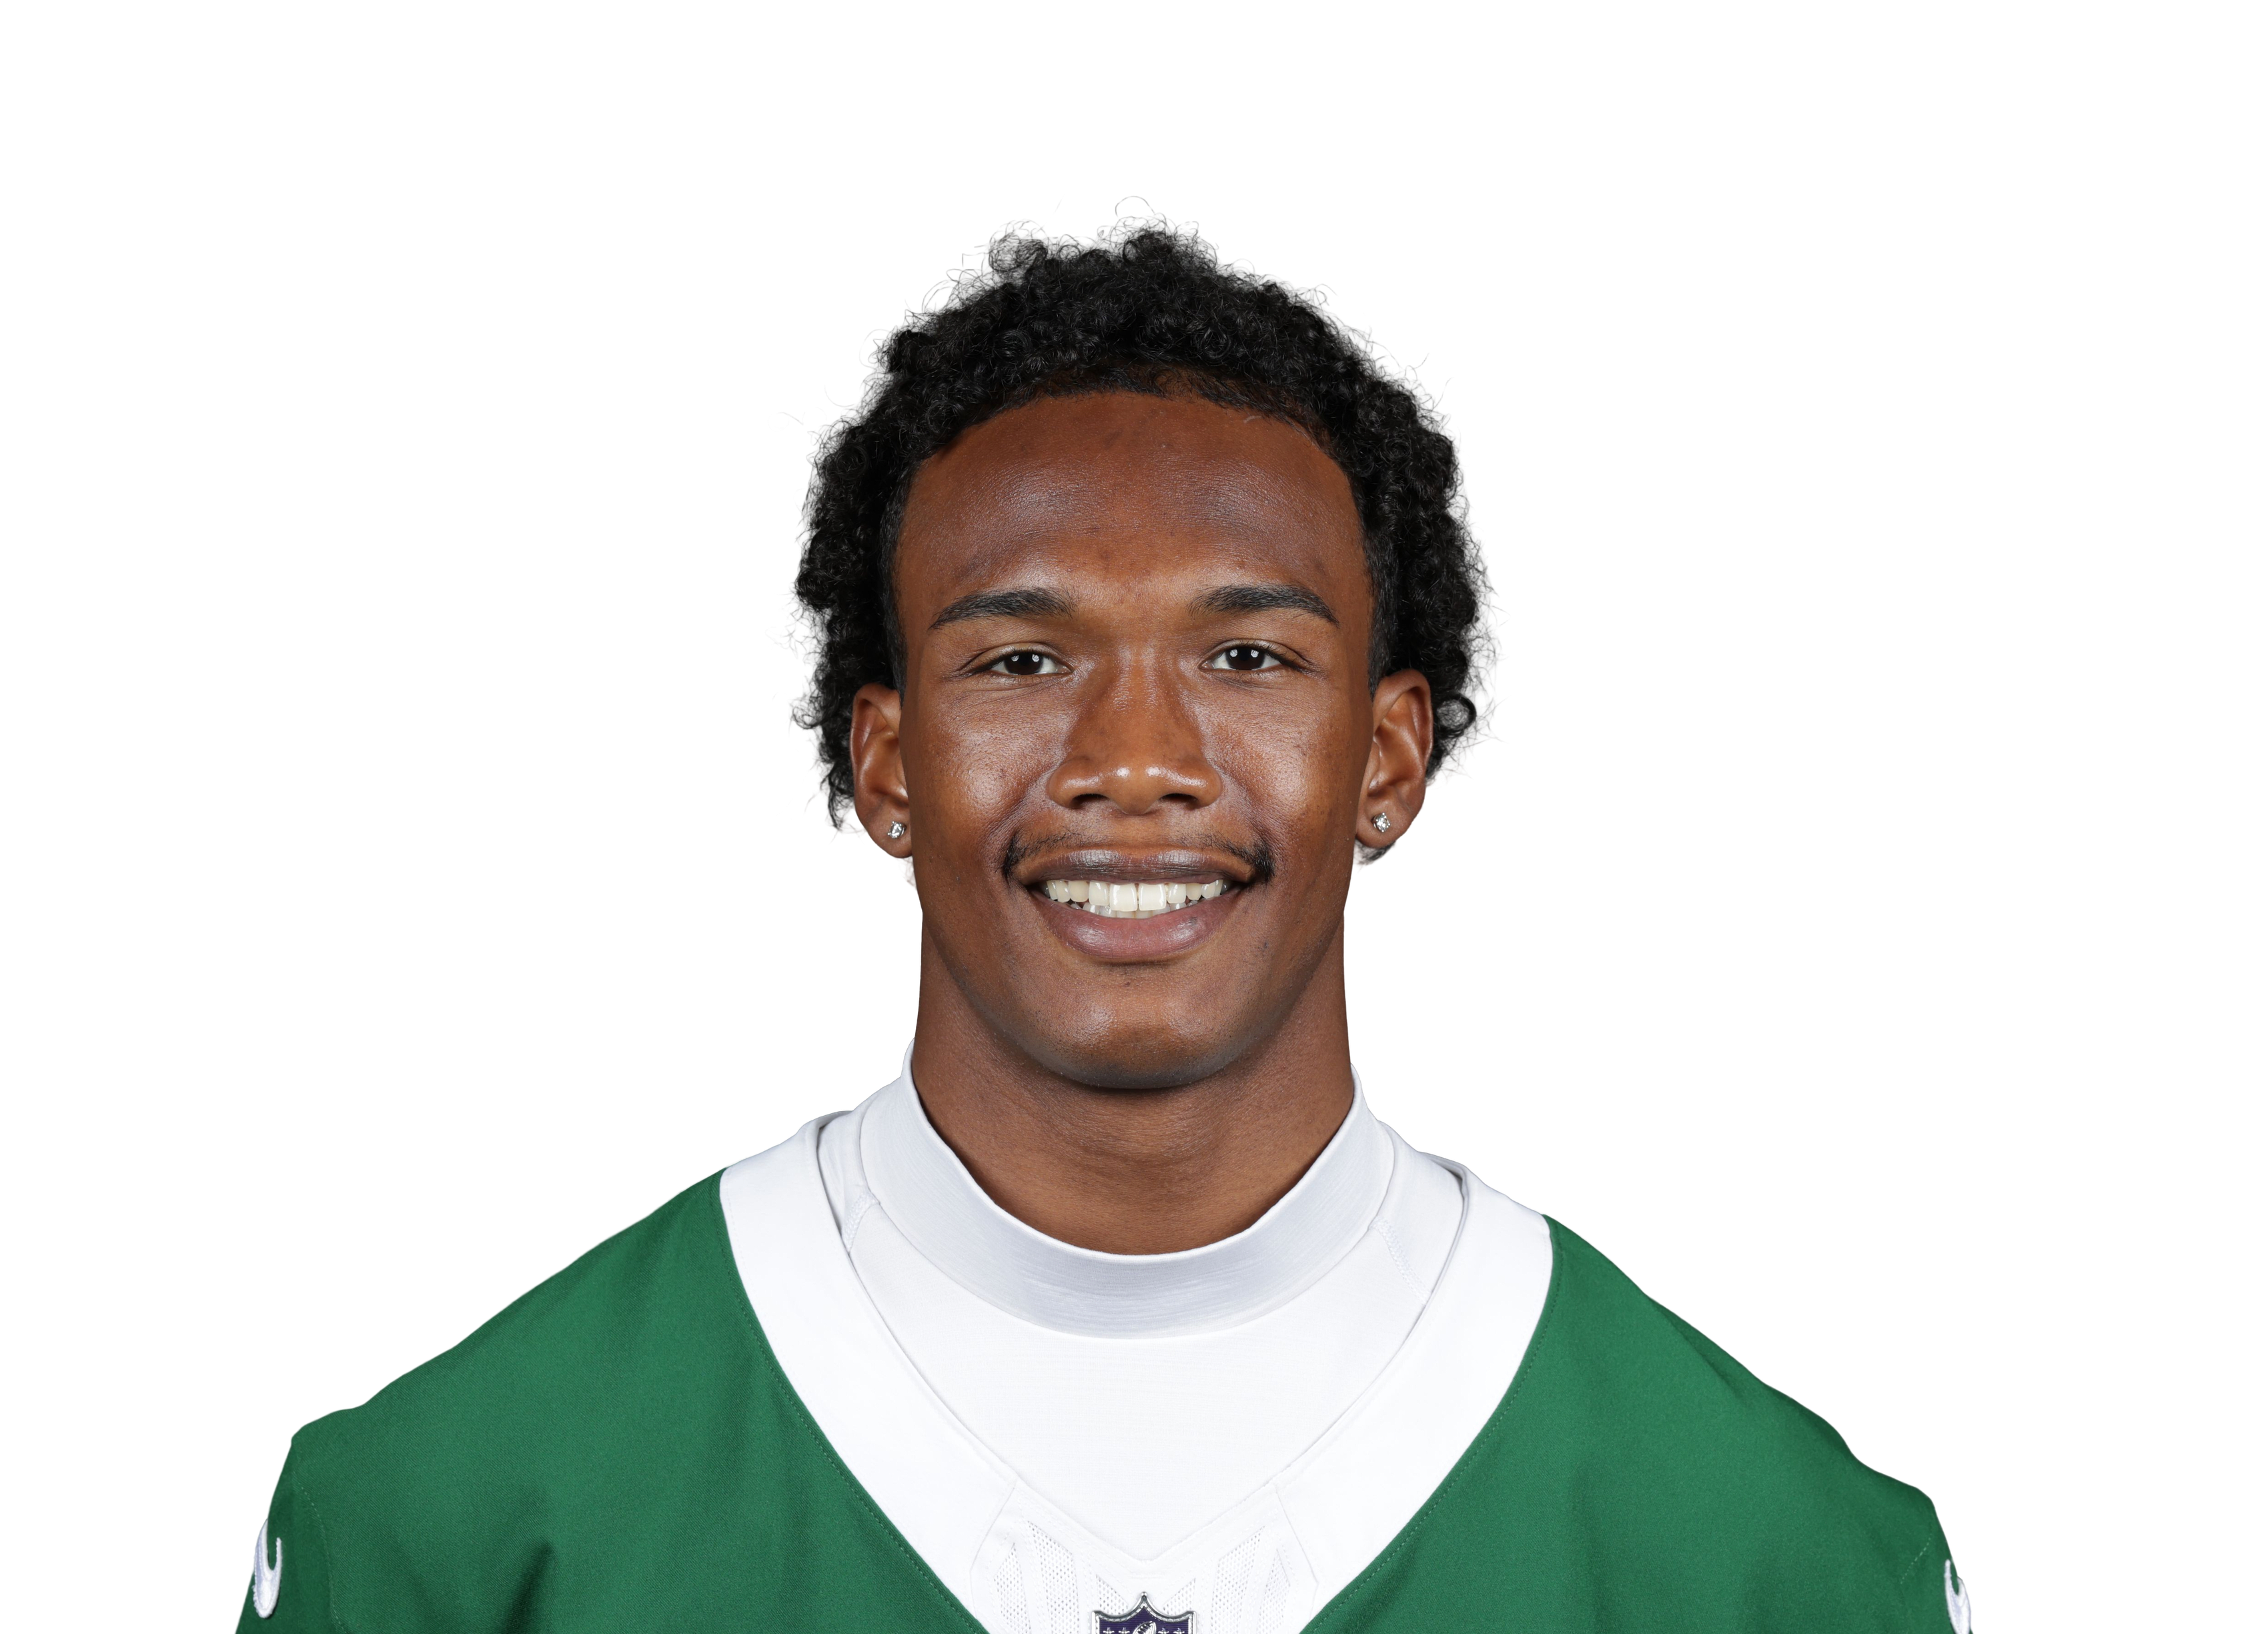
- the Jets rank 20th against deep balls, and 9% of Bowers's targets travel 20+ yards (the average TE is at 6%).
- Work the left side: 36% of his targets go that way and the Jets rank 27th defending throws there.
- Contested catches aren't his edge this week: he's 7th percentile for separation and 51st for hands, and Brandon Stephens, Azareye'h Thomas and Jarvis Brownlee all allow fewer yards per target than the average corner (7.4).
- Free data doesn't show who covers whom on each snap, so this is the defence's profile, not a confirmed one-on-one.
Where his targets come from
Share of his targets. The white tick is the league average.
How LV defend it
Ranked of 32, last 17 games. Green is a weakness to attack.
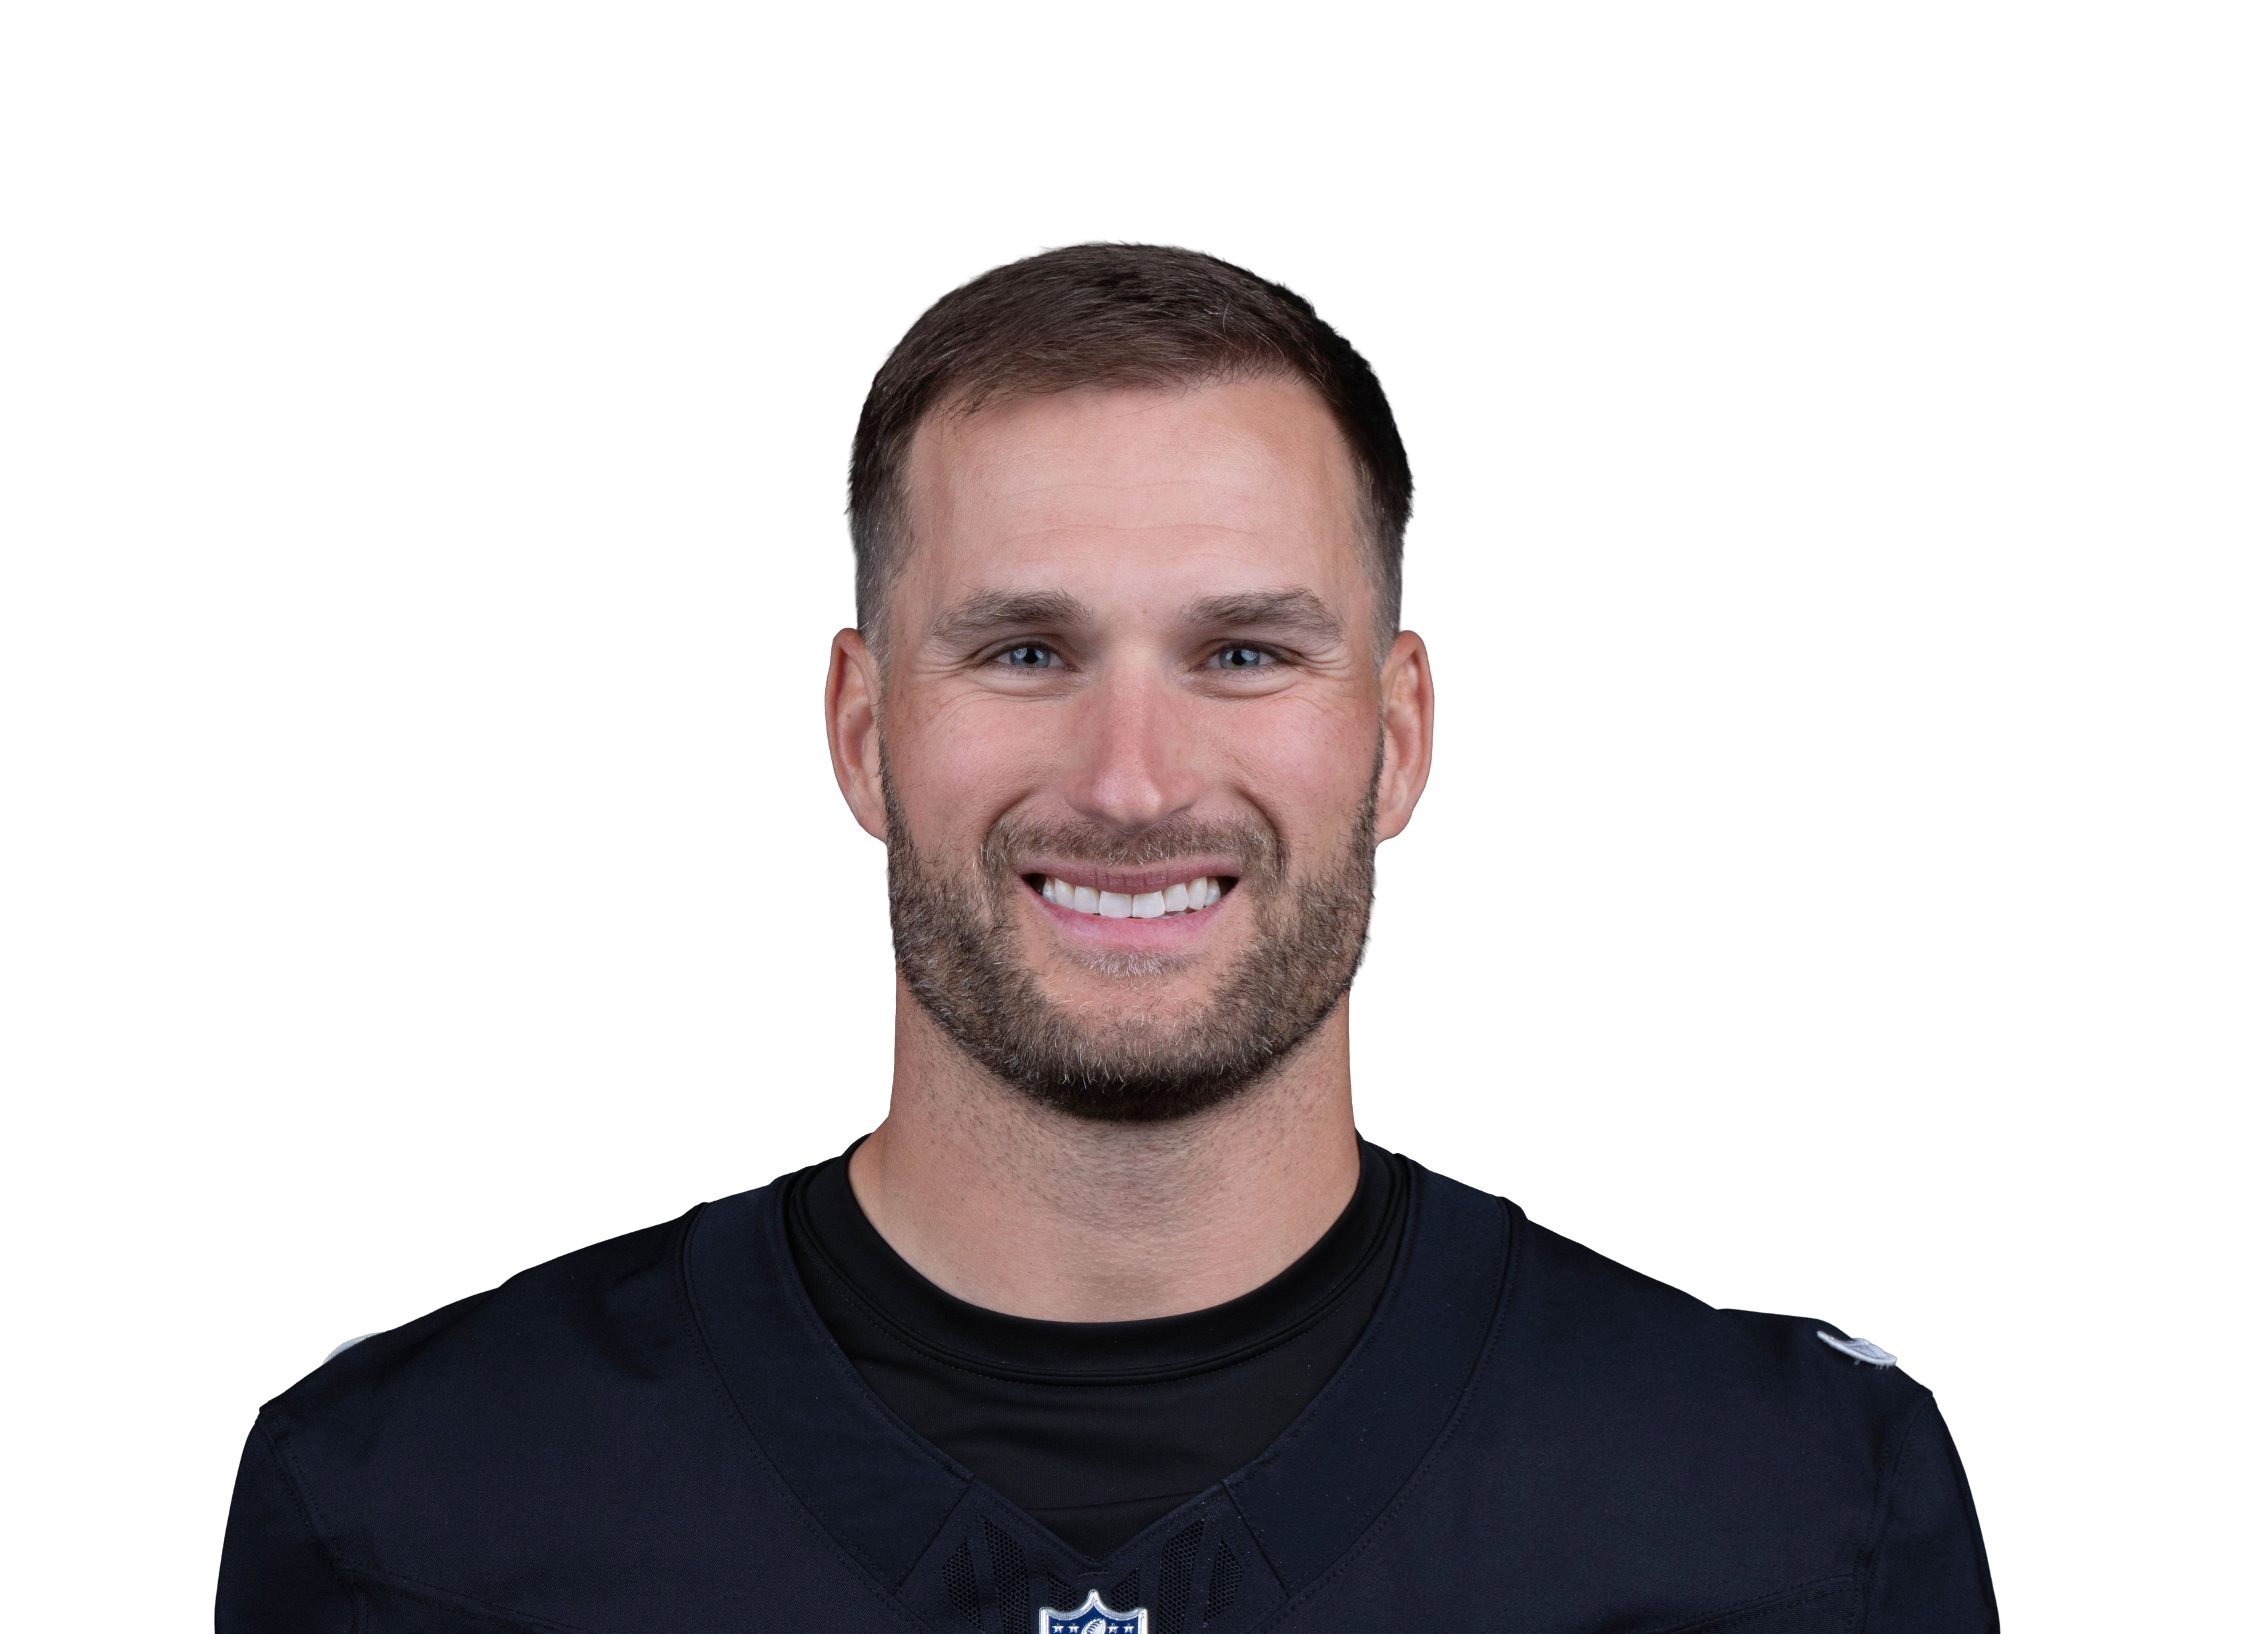
- Las Vegas rank 28th against short throws, which make up 67% of Wilson's targets.
- Work the right side: 42% of his targets go that way and Las Vegas rank 27th defending throws there.
- Contested catches aren't his edge this week: he's 74th percentile for separation and 33rd for hands, and Eric Stokes and Taron Johnson both allow fewer yards per target than the average corner (7.4).
- Free data doesn't show who covers whom on each snap, so this is the defence's profile, not a confirmed one-on-one.
How NYJ defend it
Ranked of 32, last 17 games. Green is a weakness to attack.
- the Jets rank 30th in EPA per dropback allowed over their last 17 games, and 32nd against short throws.
- Pressure: the Jets are 19th at getting sacks, and Las Vegas are 28th at avoiding them.
Unit by unit
Each unit ranked against all 32 teams on 2026 play-by-play through week 7. Longer bar is better; a gold rank marks the side with the edge.
When the Raiders have the balloffence against defence, rank of 32 (1st is best)LV offenceNYJ defenceBiggest gap: rushing, where the Jets defence has a 26-place edge.
When the Jets have the balloffence against defence, rank of 32 (1st is best)NYJ offenceLV defenceBiggest gap: pass protection, where the Raiders defence has a 14-place edge.
Form and history
Raiders this season 27-13wk 1 vs MIAW
 26-14wk 2 at LACW
 35-27wk 3 at NOL
 27-30wk 4 vs KCL
 17-45wk 5 at NEL
 30-33wk 6 vs BUFL
 21-35wk 7 vs LAJets this season12-16NYJ at LV
2023-11
Injury report
Raidersmodel impact 0.0| Jack BechWR · Forearm | IR |
| Chris CollierRB | IR |
| Carter RunyonTE | IR |
| Chigozie AnusiemCB · Knee | IR |
| Keyron CrawfordDE · Ankle | IR |
| Brennan JacksonDE | IR |
| Justin PickettG | IR |
| Patrick JohnsonLB · Neck | Questionable |
Jetsmodel impact 0.0| Arian SmithWR · Knee | IR |
| Tre BrownCB | IR |
| Tyler BaronDE · Knee | PUP |
| Braiden McGregorDE · Pectoral | IR |
| Marcelino McCrary-BallLB · Ankle | IR |
| Kiko MauigoaLB · Quadriceps | IR |
| Kingsley JonathanDT · Thigh | IR |
| David OnyemataDT · Groin | IR |
| VJ PayneDB | IR |
| Anez CooperG · Shoulder | IR |
| Kene NwangwuRB · Knee | Questionable |
| Breece HallRB · Quadriceps | Questionable |
Player props
Every posted line with the market's view and each player's last ten games against it.
Player props for this game haven't been posted by the books yet. They usually land Thursday to Saturday.
The betting view
Posted odds, the same odds with the bookmaker's margin removed, and where the model disagrees.
Read this before you bet: picking winners is not beating the price. At posted odds our 2025 flat-bet ROI was −6.9%. Use the model as one view of the game, not a tip.
What the model sees
Split signal: win probability leans LV (51%) while the points model has NYJ by 0.3 — low agreement, treat as a coin flip.