 PIT
PIT CLE
CLE IND
IND WAS
WAS ARI
ARI NYG
NYG DAL
DAL HOU
HOU GB
GB TB
TB JAX
JAX CIN
CIN LA
LA PHI
PHI NE
NE BUF
BUF NYJ
NYJ CHI
CHI TEN
TEN BAL
BAL MIA
MIA MIN
MIN DEN
DEN SF
SF LAC
LAC SEA
SEA DET
DET CAR
CAR ATL
ATL NO
NO

This looks like a close contest, but we give a slight edge to KC. KC have been hot lately, winning 3 of their last 3. LV have been rolling at home, winning 3 of their last 3.
Matchups to watch
How each player gets his production, set against how this opponent has defended it over their last 17 games. After the game we grade who won each one.
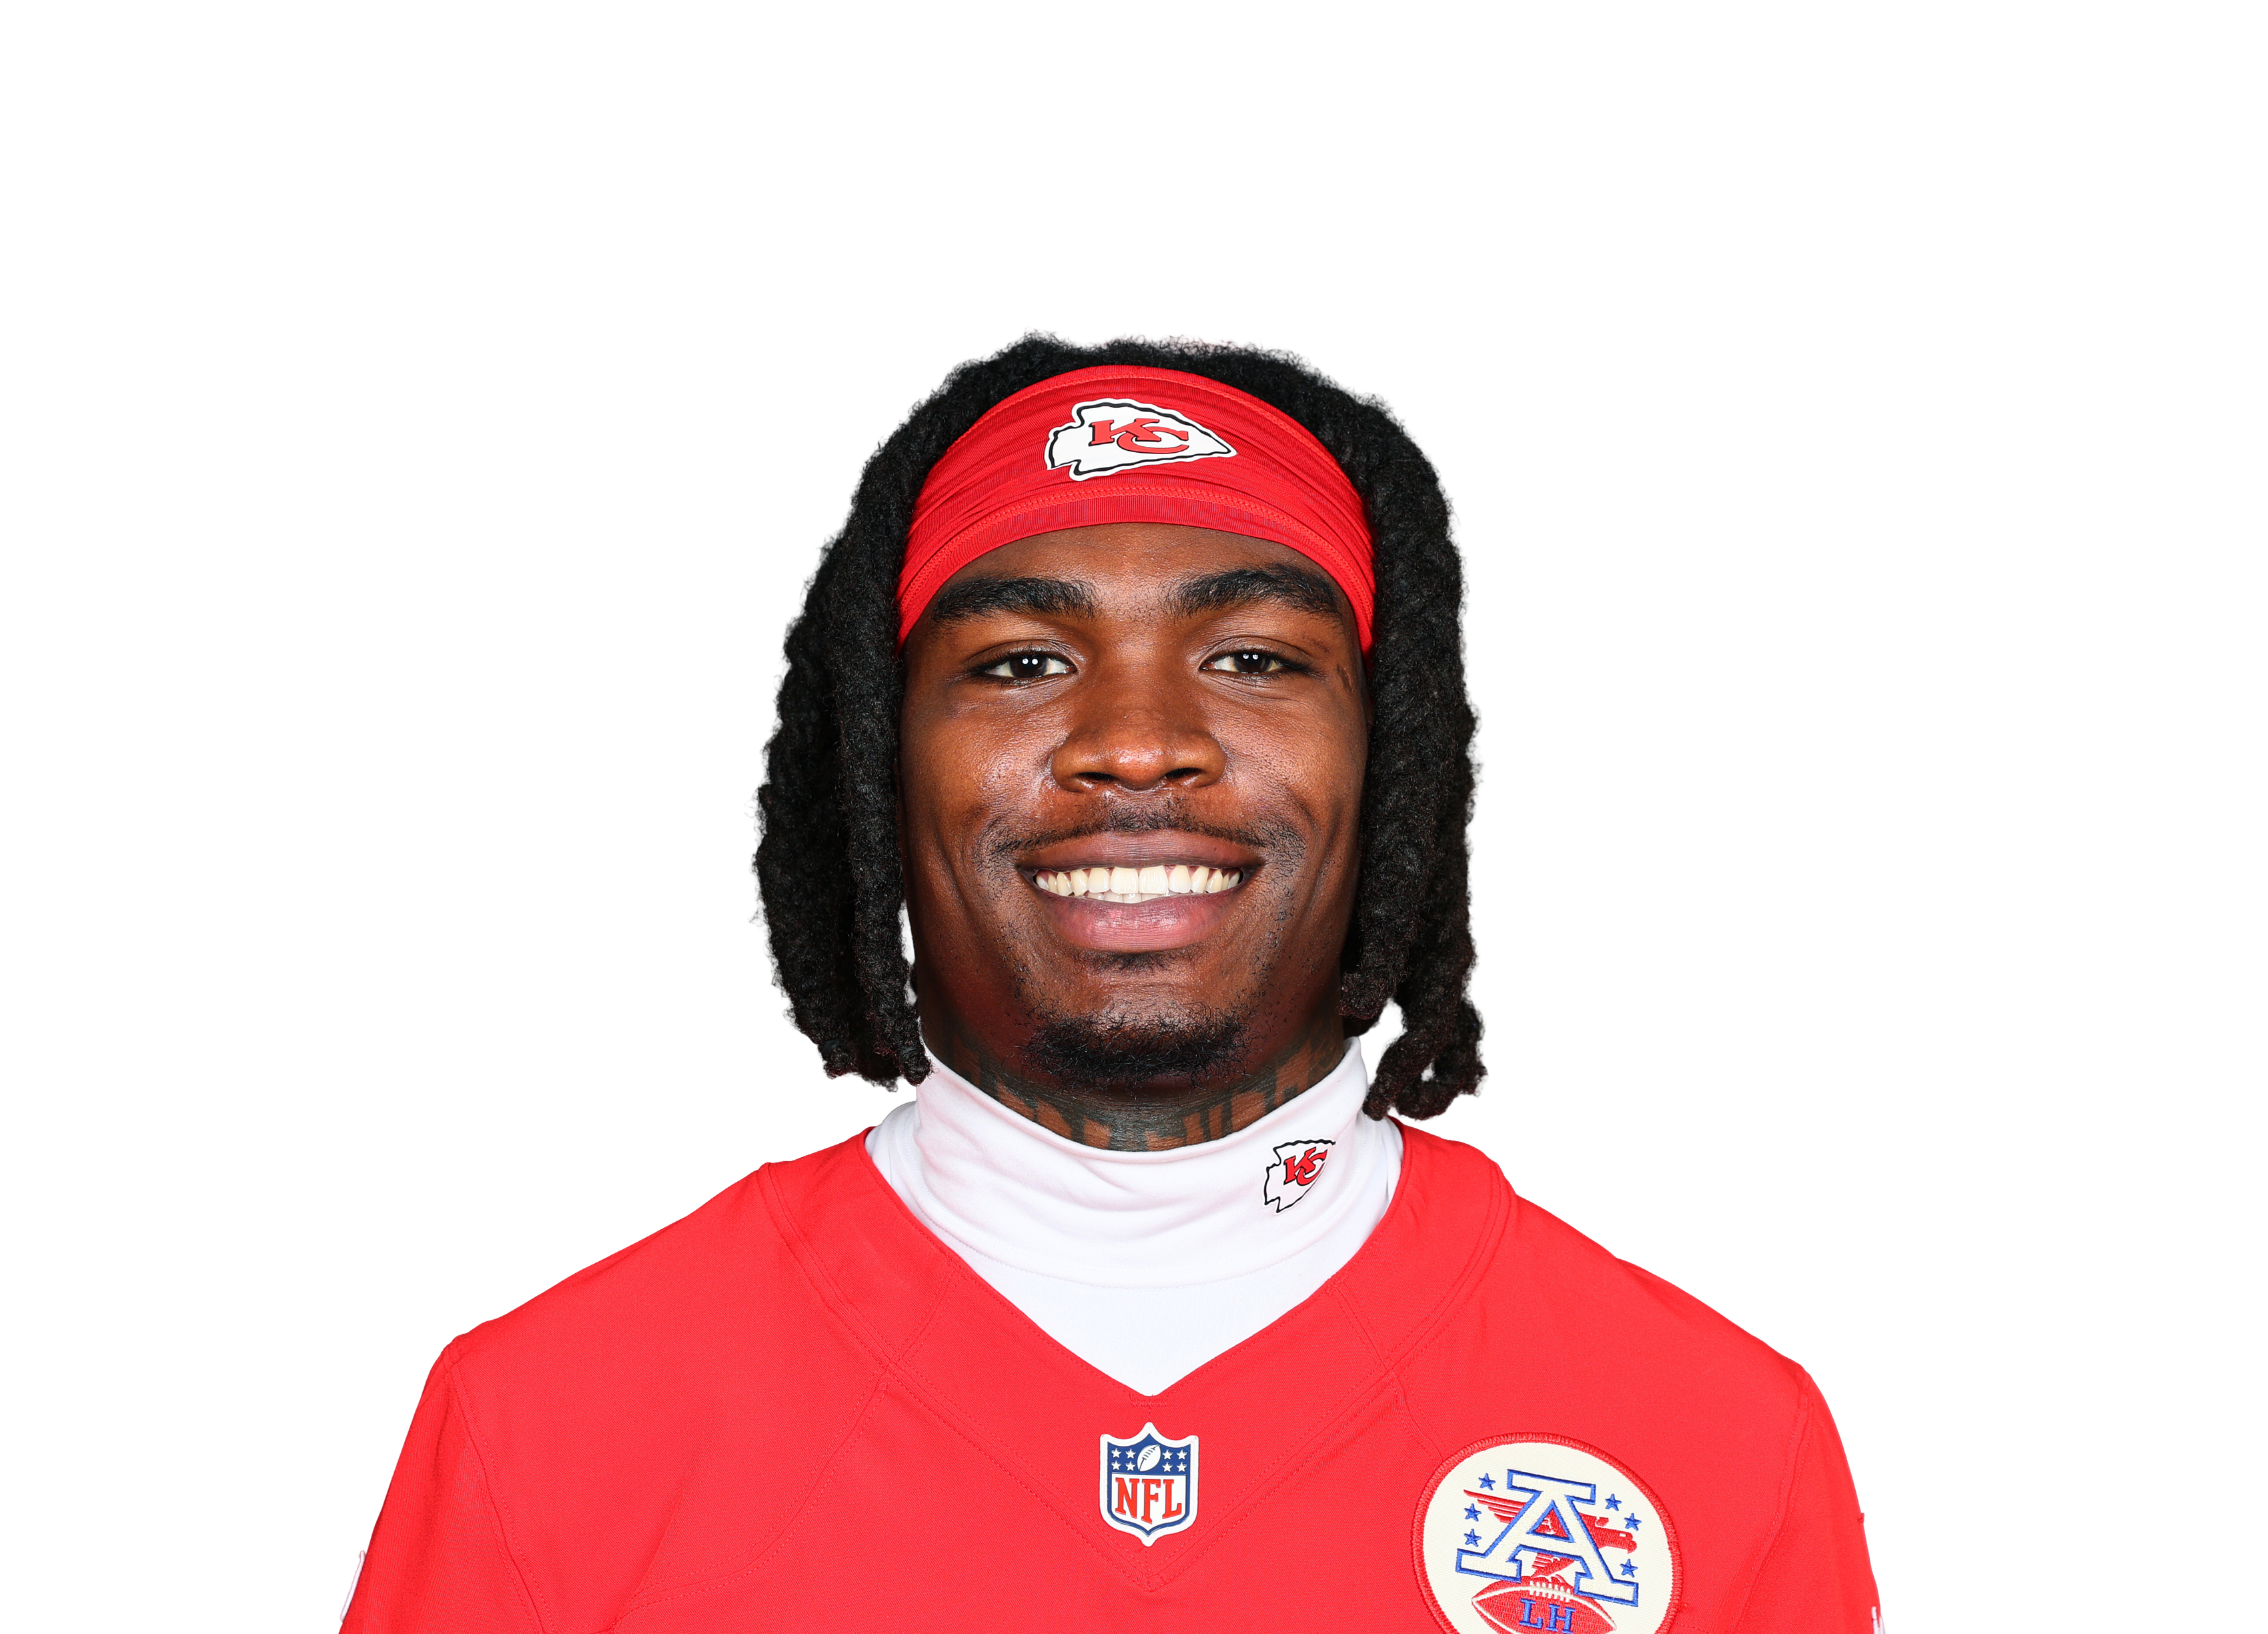
Where his targets come from
Share of his targets. The white tick is the league average.
How LV defend it
Ranked of 32, last 17 games. Green is a weakness to attack.
- Las Vegas rank 25th against short throws, which make up 75% of Rice's targets.
- Free data doesn't show who covers whom on each snap, so this is the defence's profile, not a confirmed one-on-one.
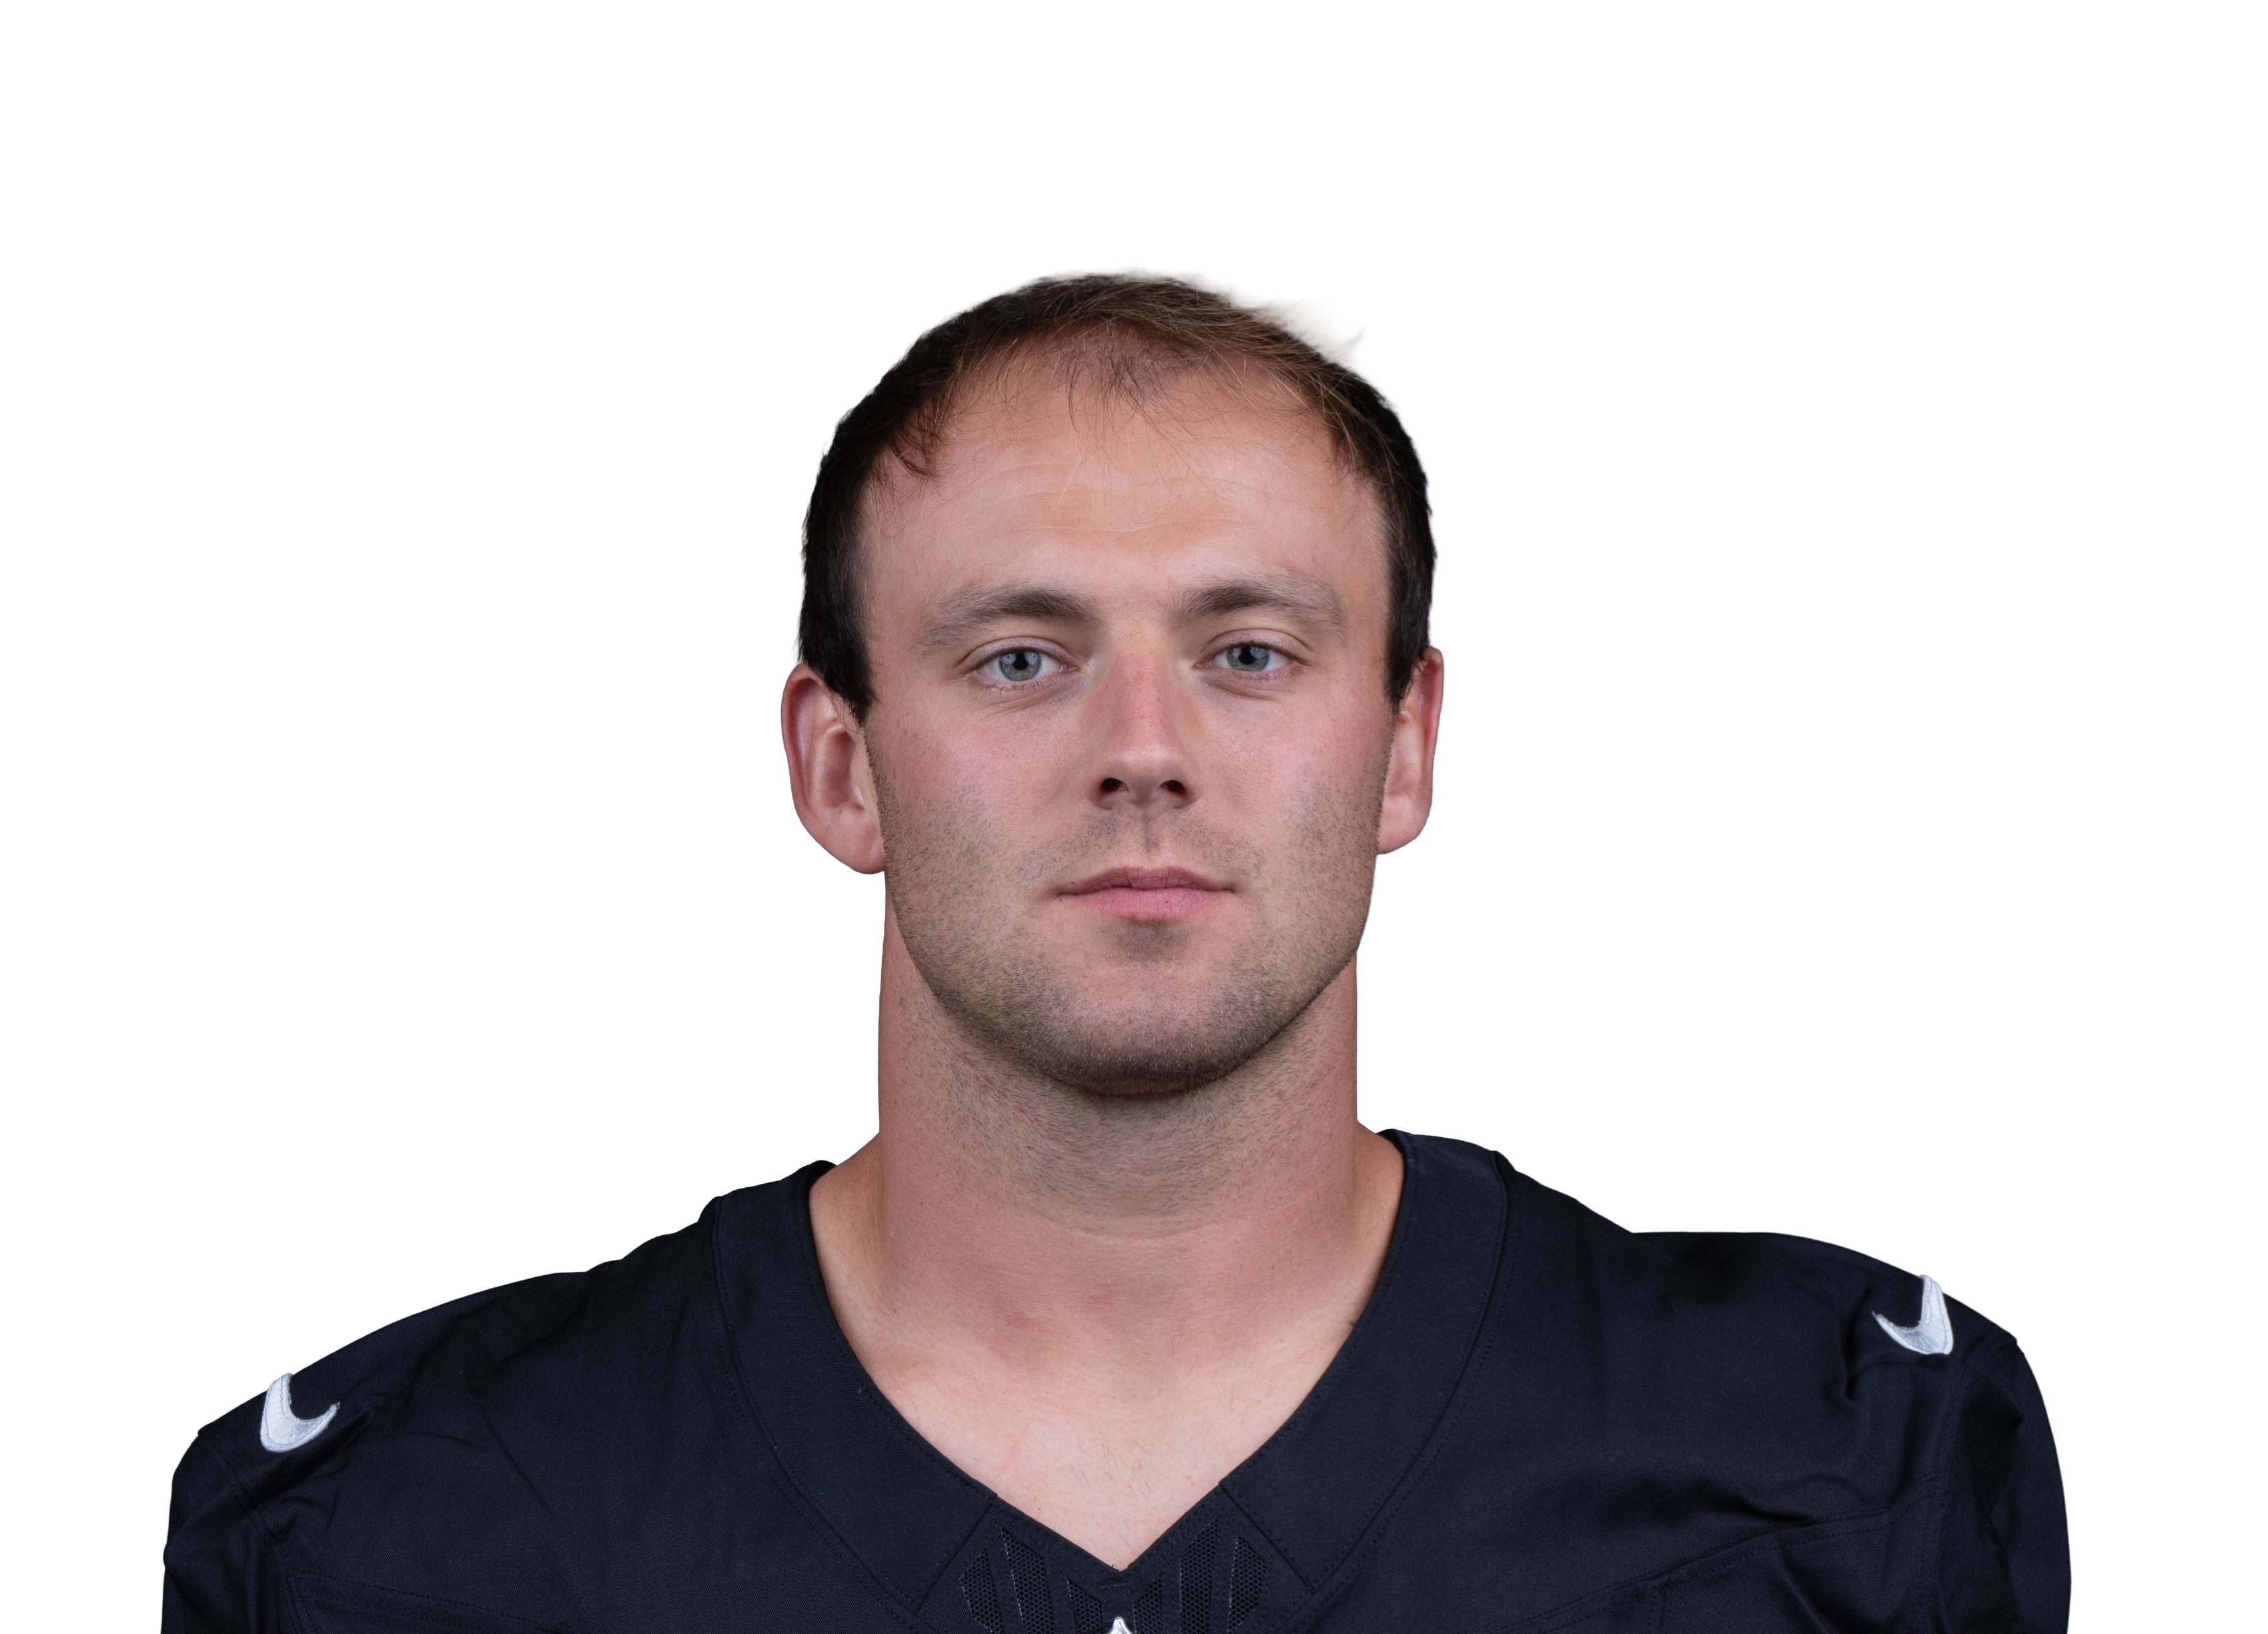
Where his targets come from
Share of his targets. The white tick is the league average.
How KC defend it
Ranked of 32, last 17 games. Green is a weakness to attack.
- Kansas City rank 19th against deep balls, which make up 8% of Bowers's targets.
- Contested catches aren't his edge this week: he's 11th percentile for separation and 34th for hands, and Jaylen Watson, Nohl Williams, Trent McDuffie and Kristian Fulton all allow fewer yards per target than the average corner (7.4).
- Free data doesn't show who covers whom on each snap, so this is the defence's profile, not a confirmed one-on-one.
Unit by unit
Each unit ranked against all 32 teams on 2026 play-by-play through week 3. Longer bar is better; a gold rank marks the side with the edge.
When the Chiefs have the balloffence against defence, rank of 32 (1st is best)KC offenceLV defenceBiggest gap: third down, where the Chiefs offence has a 10-place edge.
When the Raiders have the balloffence against defence, rank of 32 (1st is best)LV offenceKC defenceBiggest gap: pass protection, where the Raiders offence has a 17-place edge.
Only 3 weeks of data so far: treat ranks as a direction, not a verdict.
Form and history
Chiefs this seasonRaiders this season12-14KC at LV2026-01
0-31LV at KC2025-10
17-19LV at KC2024-11
27-20KC at LV2024-10
20-14LV at KC2023-12
Injury report
Chiefsmodel impact 0.0| Jimmy HolidayWR | IR |
| Jeff CaldwellWR · Knee | IR |
| John Michael GyllenborgTE · Knee | IR |
| Ethan DownsDE · Knee - ACL | IR |
| Cooper McDonaldLB · Knee | IR |
| Omarr Norman-LottDT · Knee - ACL | PUP |
| Josh SimmonsOL · Back | Questionable |
| Chamarri ConnerDB · Knee | Questionable |
| Joe ForsonWR | NA |
Raidersmodel impact 0.0| Corey RuckerWR | IR |
| Jack BechWR · Forearm | IR |
| Dont'e ThorntonWR | IR |
| Chris CollierRB | IR |
| Carter RunyonTE | IR |
| Chigozie AnusiemCB · Knee | IR |
| Keyron CrawfordDE · Ankle | IR |
| Brennan JacksonDE | IR |
| Justin PickettG | IR |
| Aidan O'ConnellQB · Personal | Questionable |
| Justin ShorterWR | Questionable |
| Jackson Powers-JohnsonOL · Groin | Questionable |
Player props
Every posted line with the market's view and each player's last ten games against it.
Player props for this game haven't been posted by the books yet. They usually land Thursday to Saturday.
The betting view
Posted odds, the same odds with the bookmaker's margin removed, and where the model disagrees.
Read this before you bet: picking winners is not beating the price. At posted odds our 2025 flat-bet ROI was −6.9%. Use the model as one view of the game, not a tip.
What the model sees
Model favors KC (66%) by 4.9 points.