 WAS
 NYG
 CAR
 NO
 HOU
 CLE
 TEN
 KC
 ATL
 IND
 MIN
 LA
 ARI
 SF
 DAL
 CIN
 LAC
 BAL

We lean toward DET in this one. DET have been rolling at home, winning 4 of their last 5.
Matchups to watch
How each player gets his production, set against how this opponent has defended it over their last 17 games. After the game we grade who won each one.
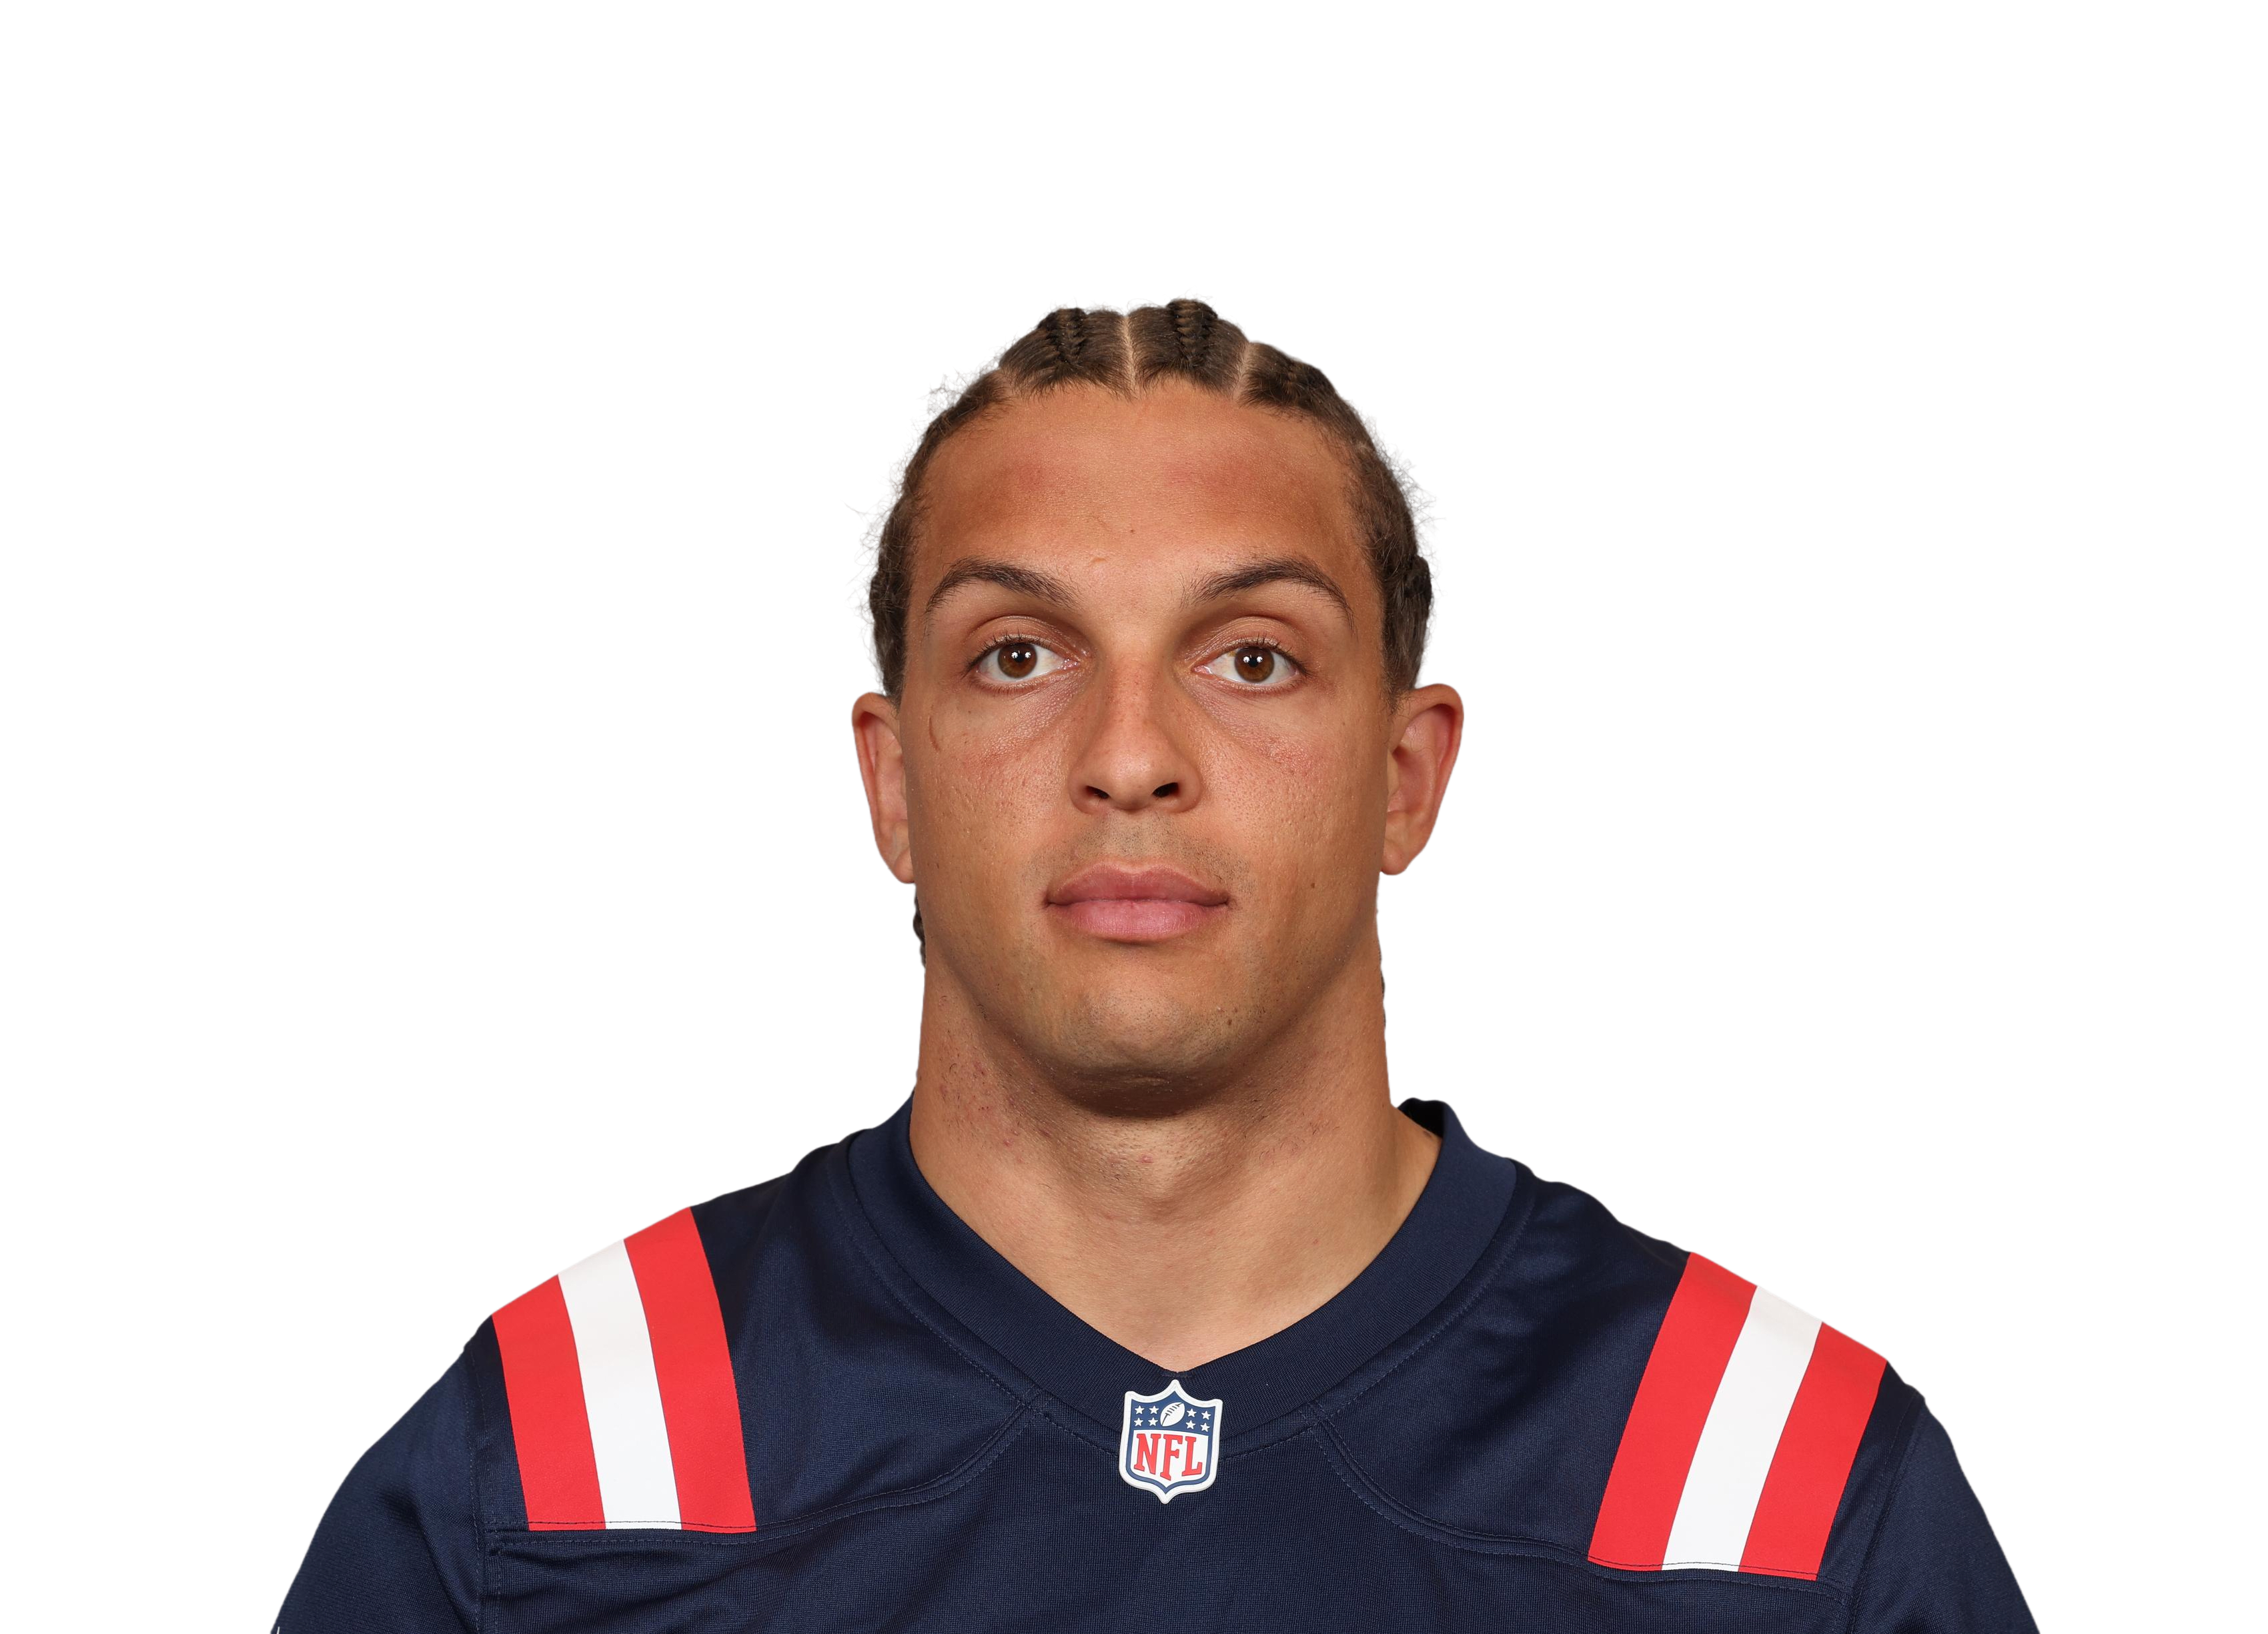
Where his targets come from
Share of his targets. The white tick is the league average.
How DET defend it
Ranked of 32, last 17 games. Green is a weakness to attack.
- Detroit rank 28th against deep balls, and 21% of Hollins's targets travel 20+ yards (the average WR is at 17%).
- Work the right side: 52% of his targets go that way and Detroit rank 29th defending throws there.
- Free data doesn't show who covers whom on each snap, so this is the defence's profile, not a confirmed one-on-one.
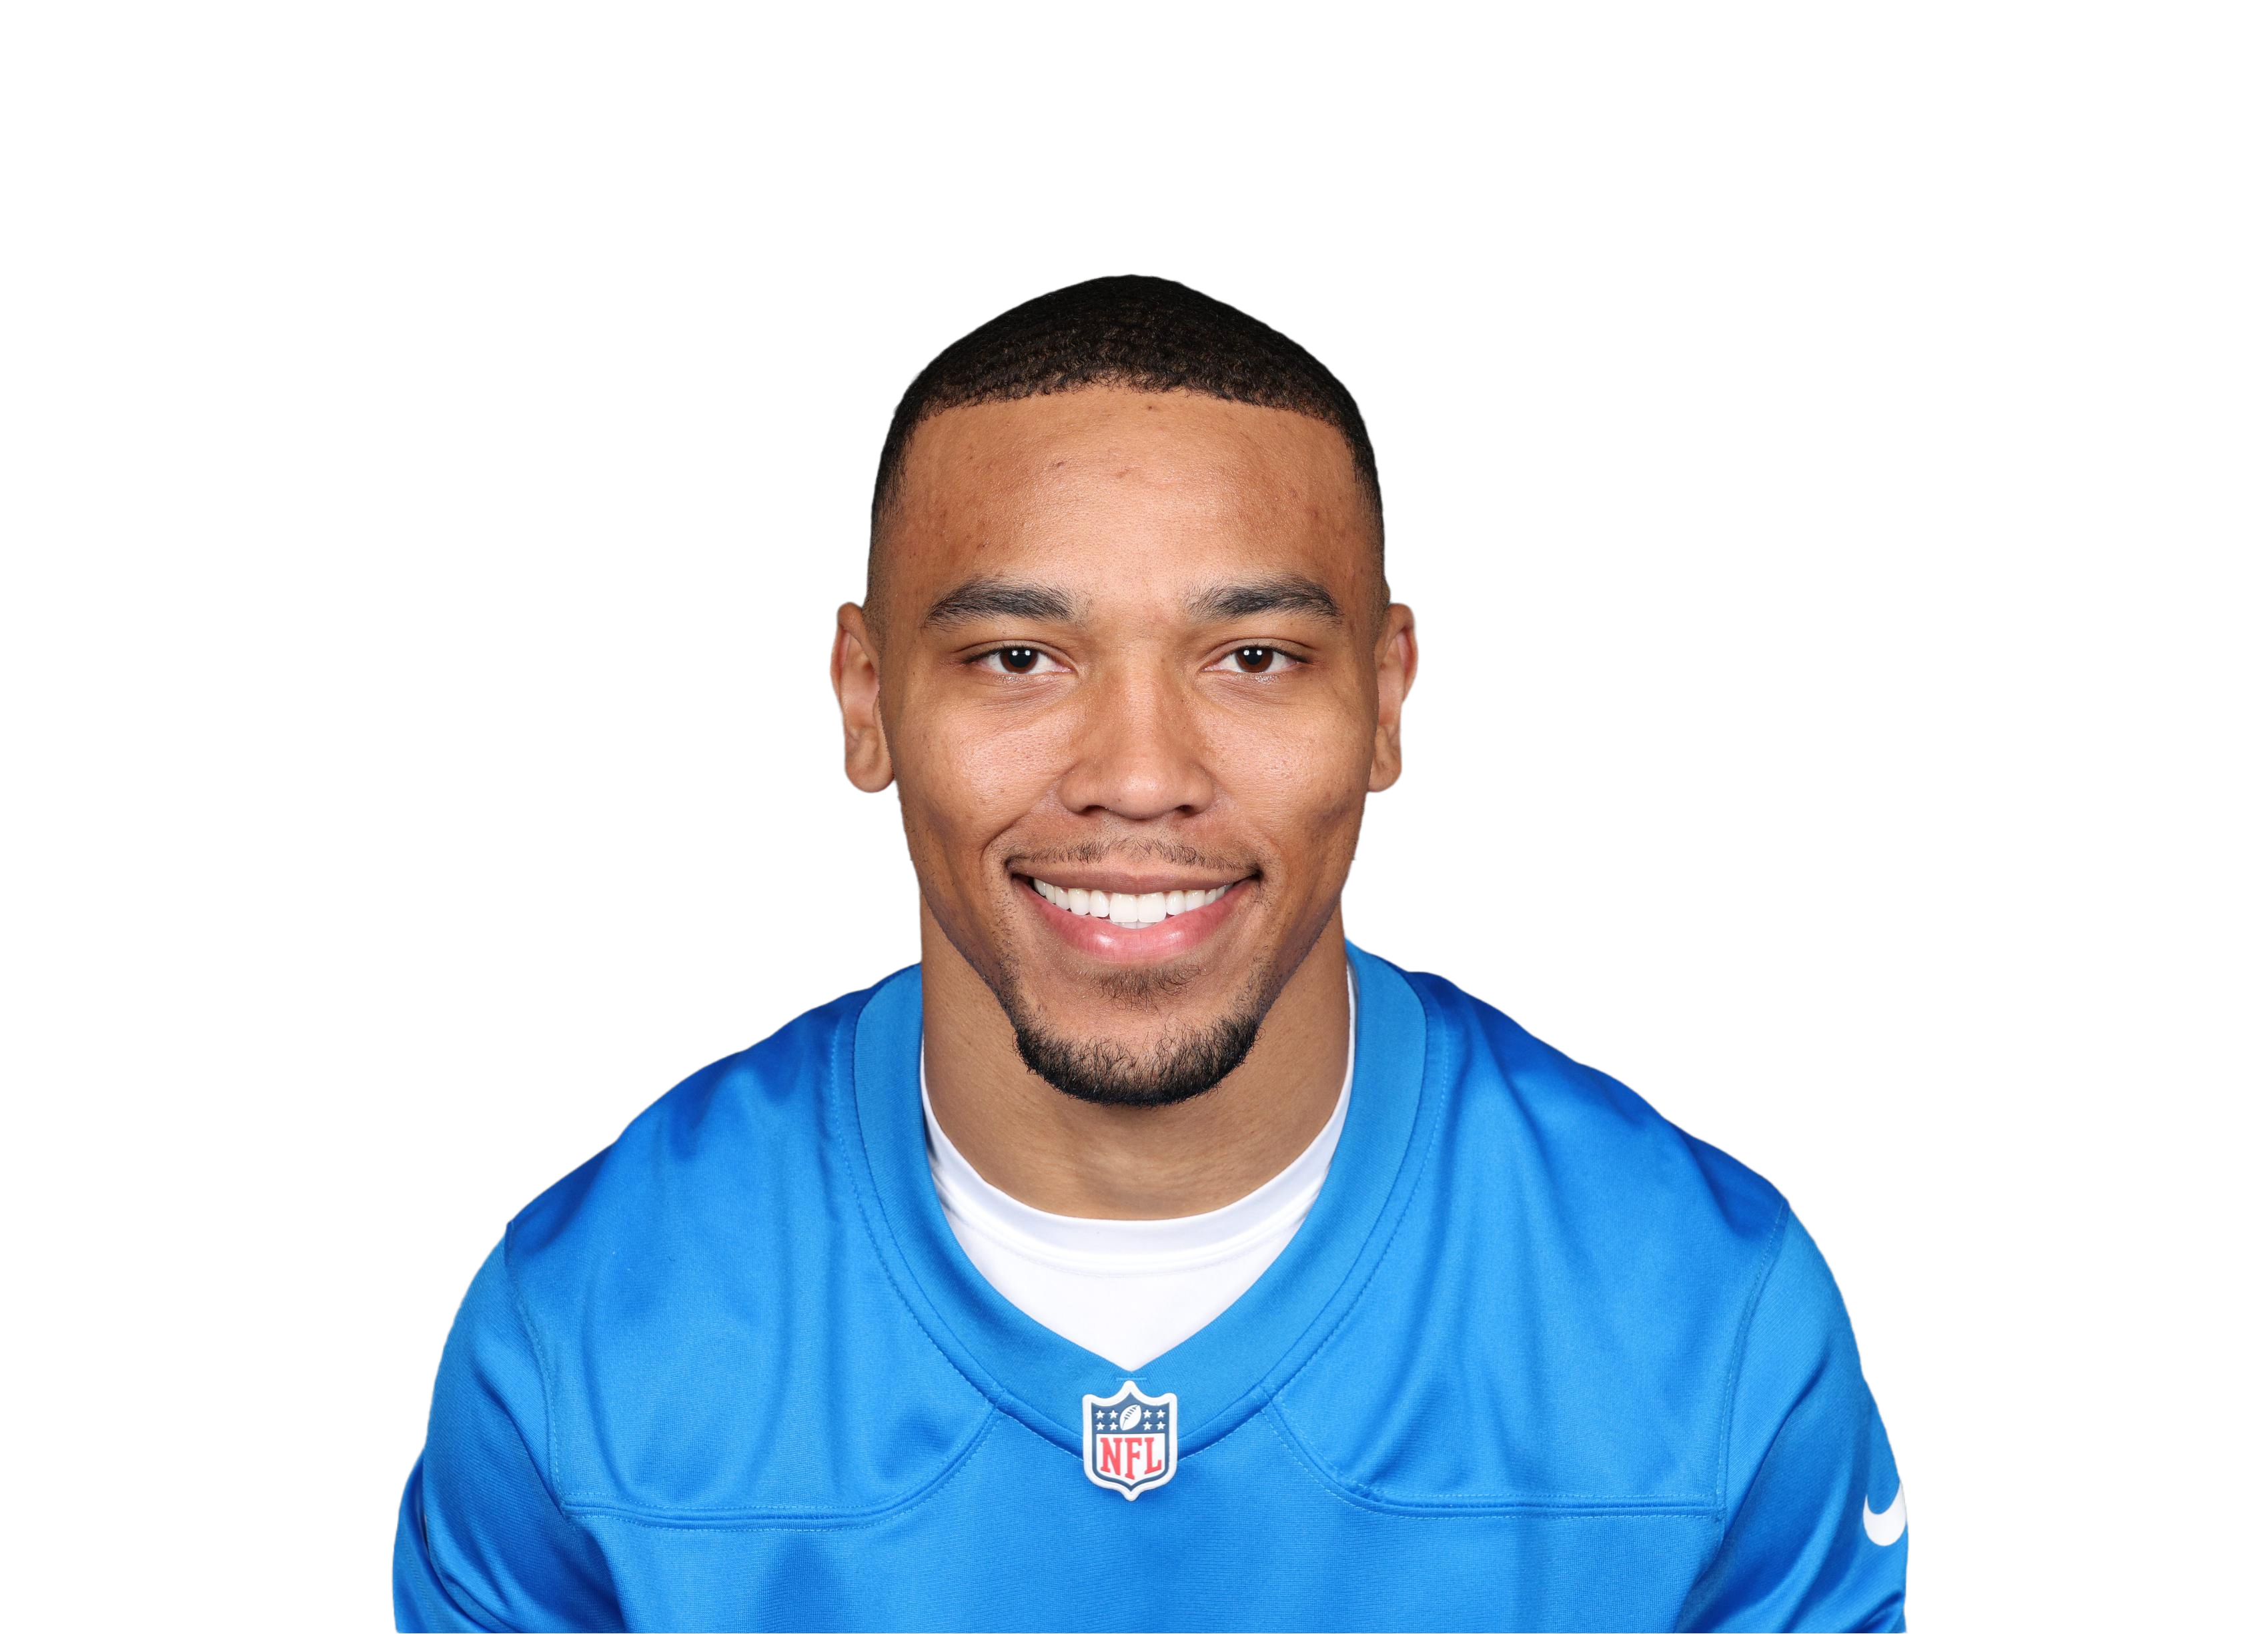
Where his targets come from
Share of his targets. The white tick is the league average.
How NE defend it
Ranked of 32, last 17 games. Green is a weakness to attack.
- New England rank 26th against intermediate throws, which make up 32% of Brown's targets.
- Contested catches aren't his edge this week: he's 67th percentile for separation and 39th for hands, and Christian Gonzalez and Carlton Davis both allow fewer yards per target than the average corner (7.4).
- Free data doesn't show who covers whom on each snap, so this is the defence's profile, not a confirmed one-on-one.
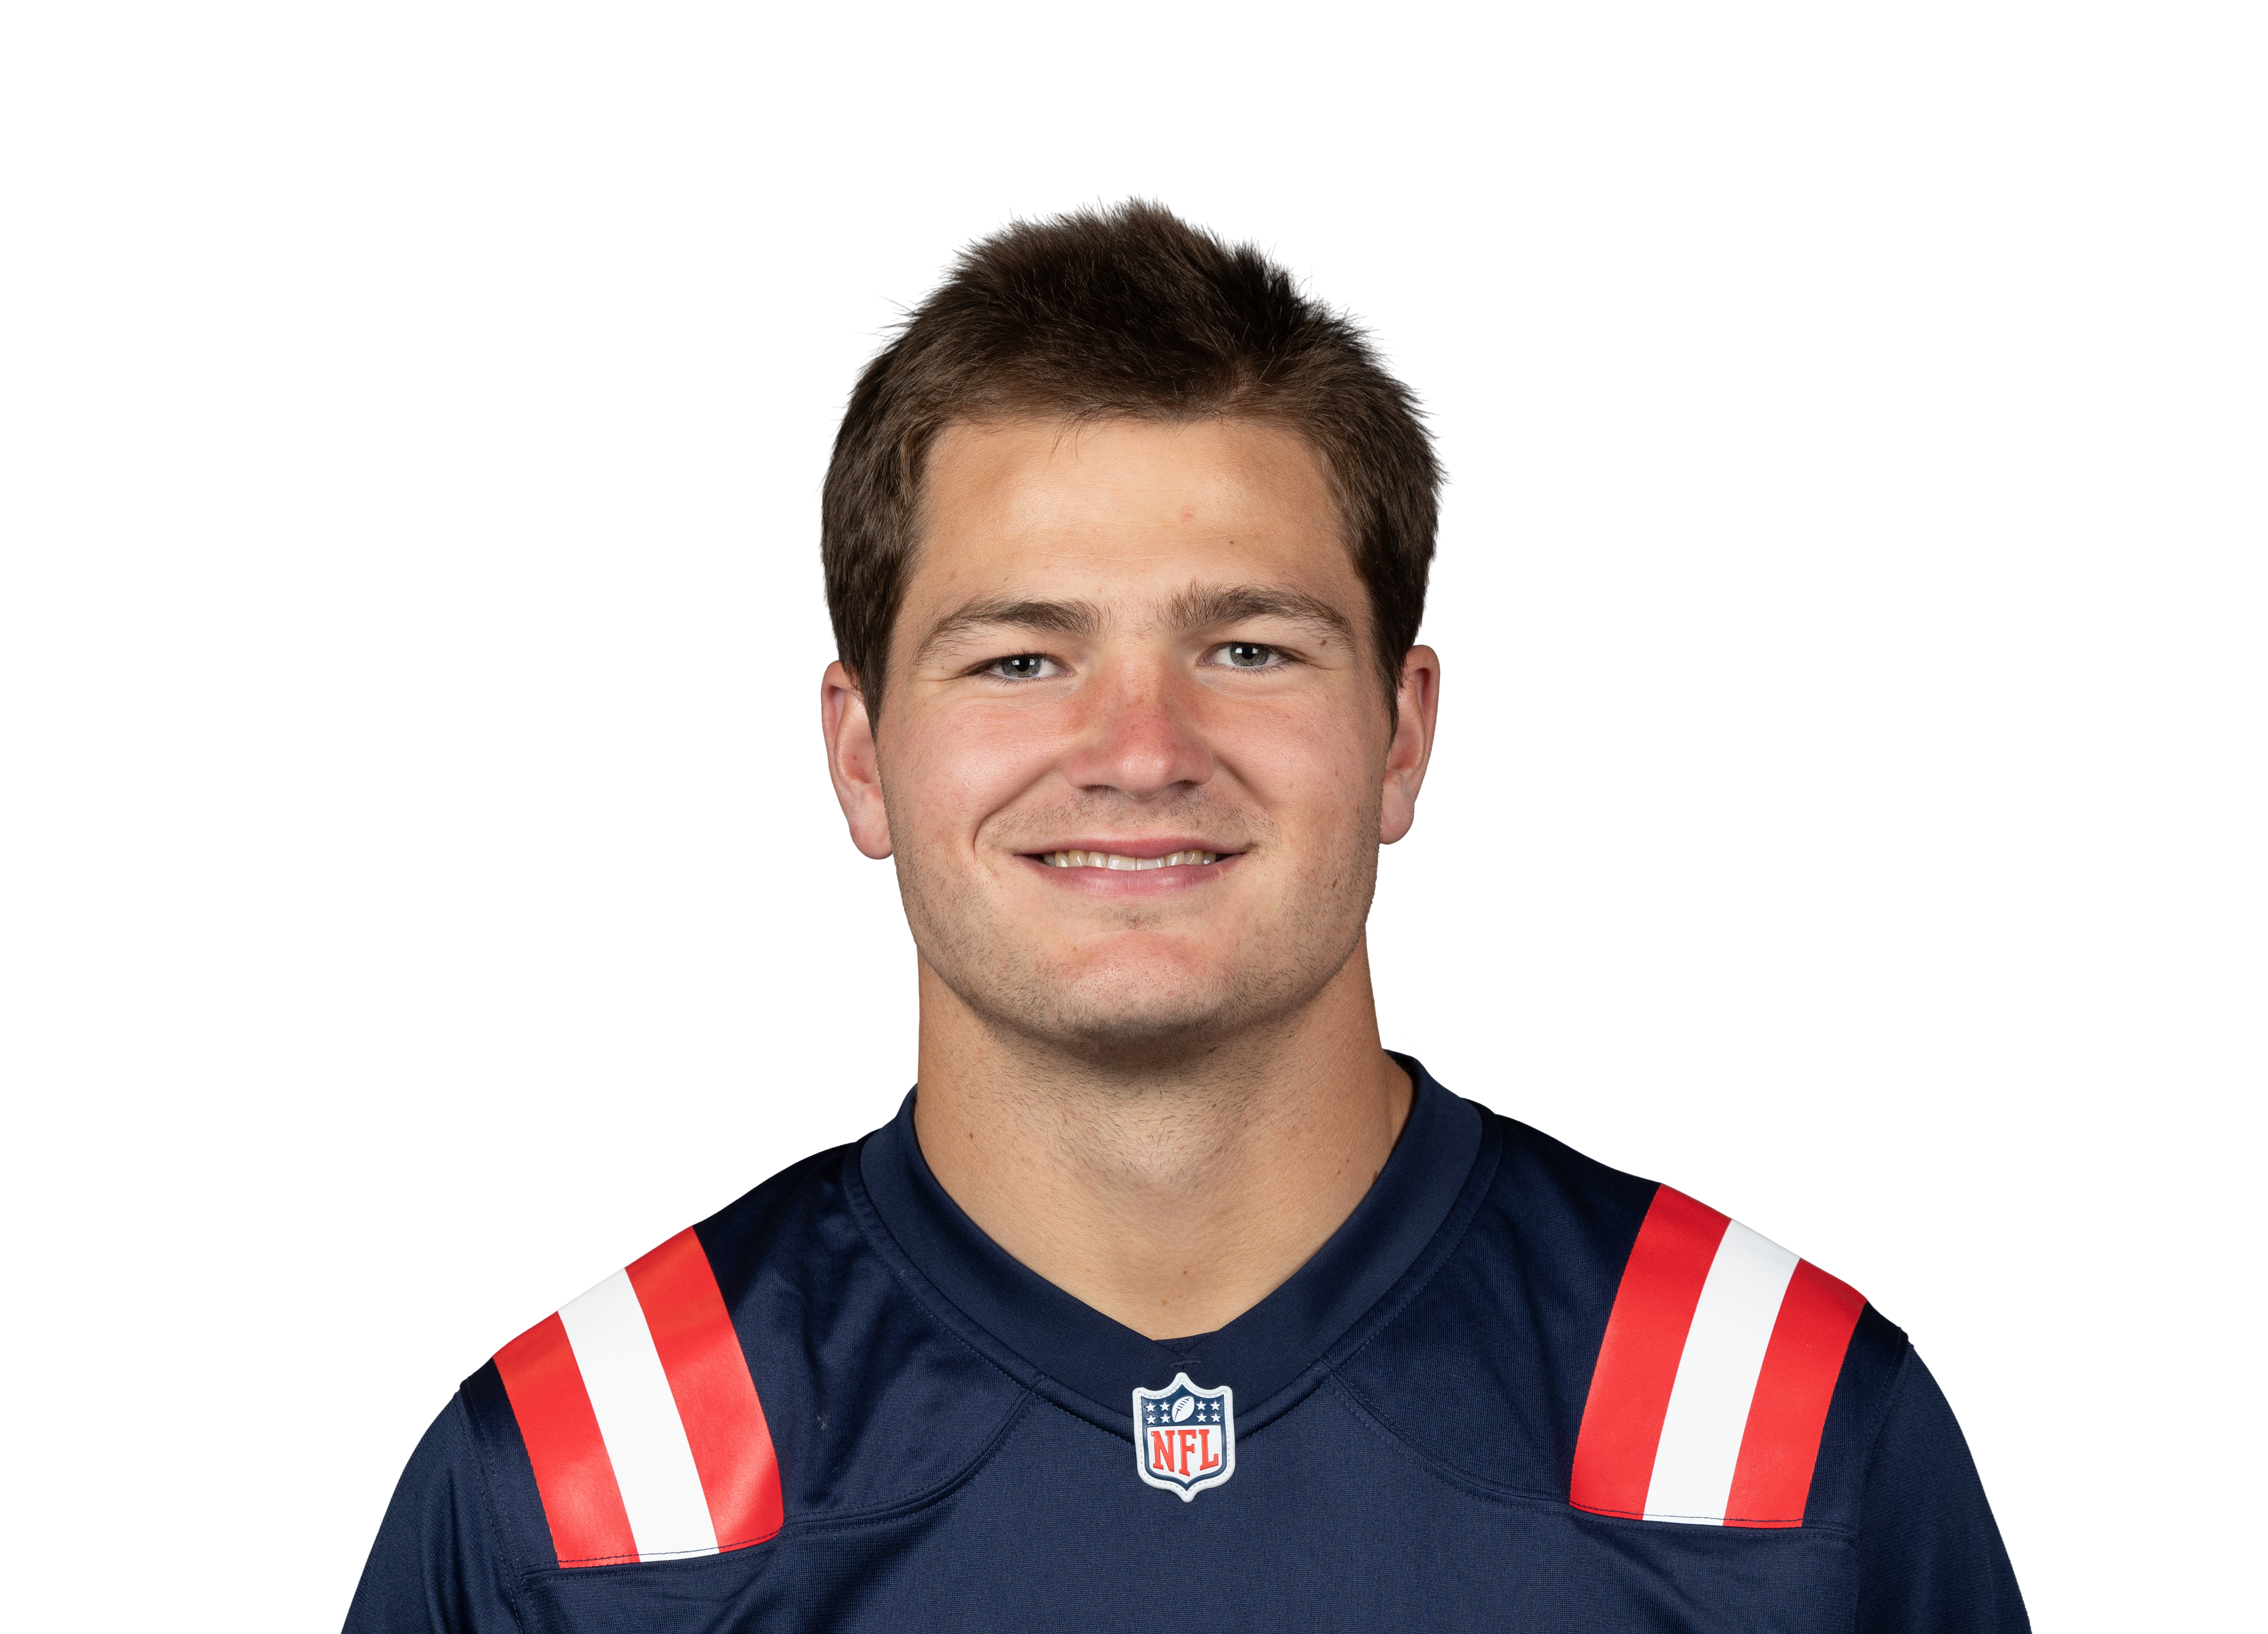
How DET defend it
Ranked of 32, last 17 games. Green is a weakness to attack.
- Detroit rank 24th in EPA per dropback allowed over their last 17 games, and 28th against deep balls.
- Pressure: Detroit are 10th at getting sacks, and New England are 10th at avoiding them.
Unit by unit
Each unit ranked against all 32 teams on 2026 play-by-play through week 9. Longer bar is better; a gold rank marks the side with the edge.
When the Patriots have the balloffence against defence, rank of 32 (1st is best)NE offenceDET defenceBiggest gap: overall, where the Patriots offence has a 18-place edge.
When the Lions have the balloffence against defence, rank of 32 (1st is best)DET offenceNE defenceBiggest gap: passing, where the Lions offence has a 19-place edge.
Form and history
Patriots this season 10-13wk 1 at SEAW
 20-3wk 2 vs PITL
 6-35wk 3 at JAXW
 29-26wk 4 at BUFW
 45-17wk 5 vs LVW
 26-19wk 6 vs NYJL
 24-30wk 7 at CHIW
 24-19wk 8 at MIAL
 27-45wk 9 vs GBLions this season0-29DET at NE
2022-10
Injury report
Patriotsmodel impact -0.7| Romeo DoubsWR · Shoulder | IR |
| Myles MontgomeryRB | IR |
| Reggie GilliamRB · Ankle | IR |
| Julian HillTE · Knee | IR |
| Quintayvious HutchinsDE · Knee | IR |
| Khalil JacobsLB | IR |
| Harold Landry IIILB | PUP |
| Mike OnwenuOL · Ankle | IR |
| Alijah Vera-TuckerOL · Hamstring | IR |
| Greg Van RotenOG · Thigh | IR |
| Dell PettusDB · Ankle | IR |
| Rhamondre StevensonRB · Knee | Doubtful |
Lionsmodel impact 0.0| Tom KennedyWR · Knee - MCL | IR |
| Kendrick LawWR · Knee - ACL | IR |
| Isiah PachecoRB · Back | IR |
| Avonte MaddoxCB · Foot | IR |
| Payton TurnerDE · Back | IR |
| Devin WhiteLB · Forearm | IR |
| Damone ClarkLB | IR |
| Jimmy RolderLB · Hamstring | IR |
| Jack CampbellLB · Neck | IR |
| Ben BartchOL · Foot | IR |
| Giovanni ManuOL · Knee | PUP |
| Kerby JosephDB · Knee | PUP |
Player props
Every posted line with the market's view and each player's last ten games against it.
| Player | Market | Line | Price | Market over | Last 10 games | Hit rate |
|---|---|---|---|---|---|---|
| Drake MayeNE | Passing yards | 259.5 | 1.88 | 50% | 20% | |
| Jared GoffDET | Passing yards | 267.5 | 1.88 | 50% | 70% | |
| Drake MayeNE | Passing TDs | 1.5 | 1.66 | 57% | 20% | |
| Jared GoffDET | Passing TDs | 1.5 | 1.59 | 59% | 70% | |
| Corey KinerNE | Rushing yards | 51.5 | 1.90 | 50% | 50% | |
| Drake MayeNErole up | Rushing yards | 26.5 | 1.92 | 49% | 60% | |
| Jahmyr GibbsDETrole up | Rushing yards | 98.5 | 1.88 | 50% | 40% | |
| Jared GoffDETrole up | Rushing yards | 0.5 | 1.95 | 48% | 60% | |
| Sione VakiDETrole up | Rushing yards | 13.5 | 1.87 | 51% | 0% | |
| Amon-Ra St. BrownDETrole up | Receiving yards | 77.5 | 1.88 | 50% | 30% | |
| Hunter HenryNErole up | Receiving yards | 33.5 | 1.85 | 51% | 70% | |
| Isaac TeSlaaDET | Receiving yards | 17.5 | 1.92 | 49% | 30% | |
| Jahmyr GibbsDETrole up | Receiving yards | 30.5 | 1.87 | 51% | 70% | |
| Jameson WilliamsDET | Receiving yards | 54.5 | 1.88 | 50% | 50% | |
| Sam LaPortaDETrole up | Receiving yards | 44.5 | 1.91 | 49% | 60% | |
| Tanner ArkinDET | Receiving yards | 0.5 | 3.00 | 31% | 70% | |
| Amon-Ra St. BrownDET | Receptions | 7.5 | 2.09 | 45% | 40% | |
| Hunter HenryNErole up | Receptions | 3.5 | 2.34 | 40% | 80% | |
| Isaac TeSlaaDET | Receptions | 1.5 | 1.99 | 47% | 40% | |
| Jahmyr GibbsDETrole up | Receptions | 4.5 | 2.15 | 44% | 40% | |
| Jameson WilliamsDETrole up | Receptions | 3.5 | 1.80 | 52% | 70% | |
| Sam LaPortaDETrole up | Receptions | 4.5 | 2.24 | 42% | 50% |
"Market over" is the bookmaker's price with the margin taken out. Green bars are games that cleared the line. Our own prop model is switched off until it passes a public audit on 2026 data, so we show the market and the history, not a tip.
The betting view
Posted odds, the same odds with the bookmaker's margin removed, and where the model disagrees.
Read this before you bet: picking winners is not beating the price. At posted odds our 2025 flat-bet ROI was −6.9%. Use the model as one view of the game, not a tip.
What the model sees
Model favors DET (56%) by 1.1 points.