 WAS
 NYG
 NE
 DET
 BUF
 CAR
 NO
 HOU
 CLE
 JAX
 TEN
 MIN
 GB
 LA
 ARI
 SF
 DAL
 PIT
 CIN
 BAL


This looks like a close contest, but we give a slight edge to KC. ATL have been struggling, dropping 4 of their last 5.
Matchups to watch
How each player gets his production, set against how this opponent has defended it over their last 17 games. After the game we grade who won each one.
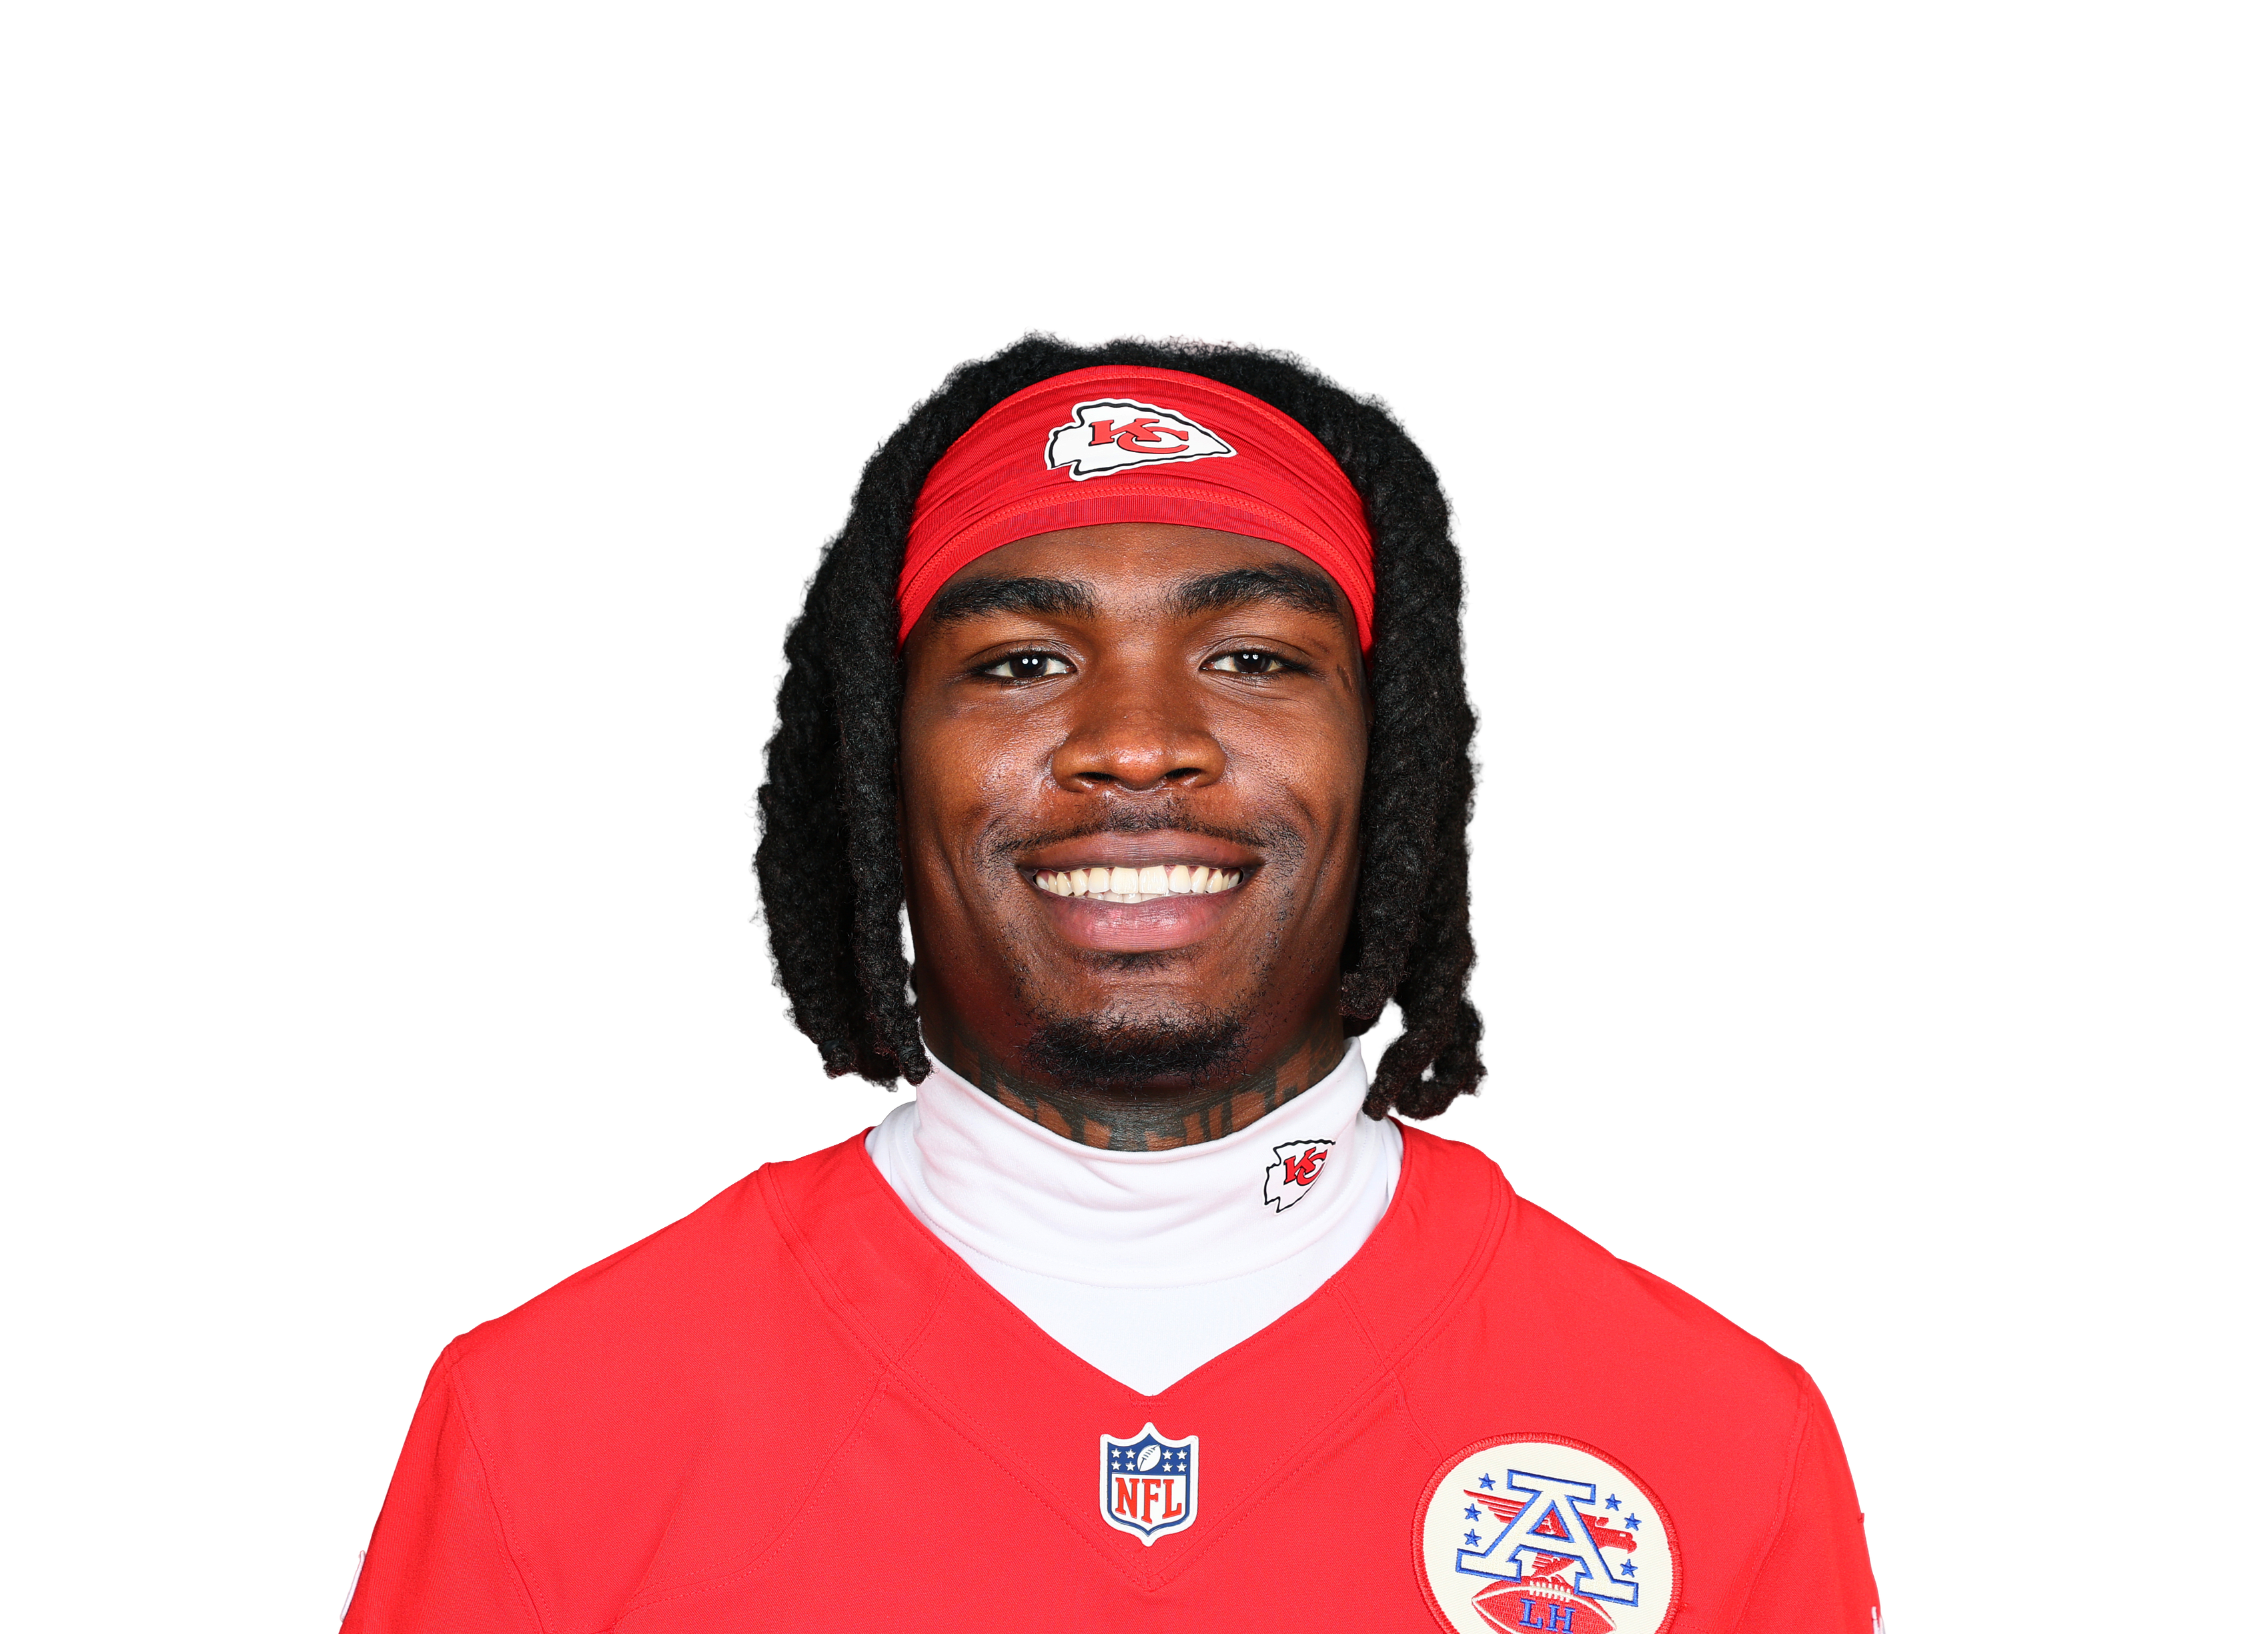
Where his targets come from
Share of his targets. The white tick is the league average.
How ATL defend it
Ranked of 32, last 17 games. Green is a weakness to attack.
- Atlanta rank 18th against short throws, which make up 77% of Rice's targets.
- Work the middle: 22% of his targets go that way and Atlanta rank 22nd defending throws there.
- Free data doesn't show who covers whom on each snap, so this is the defence's profile, not a confirmed one-on-one.
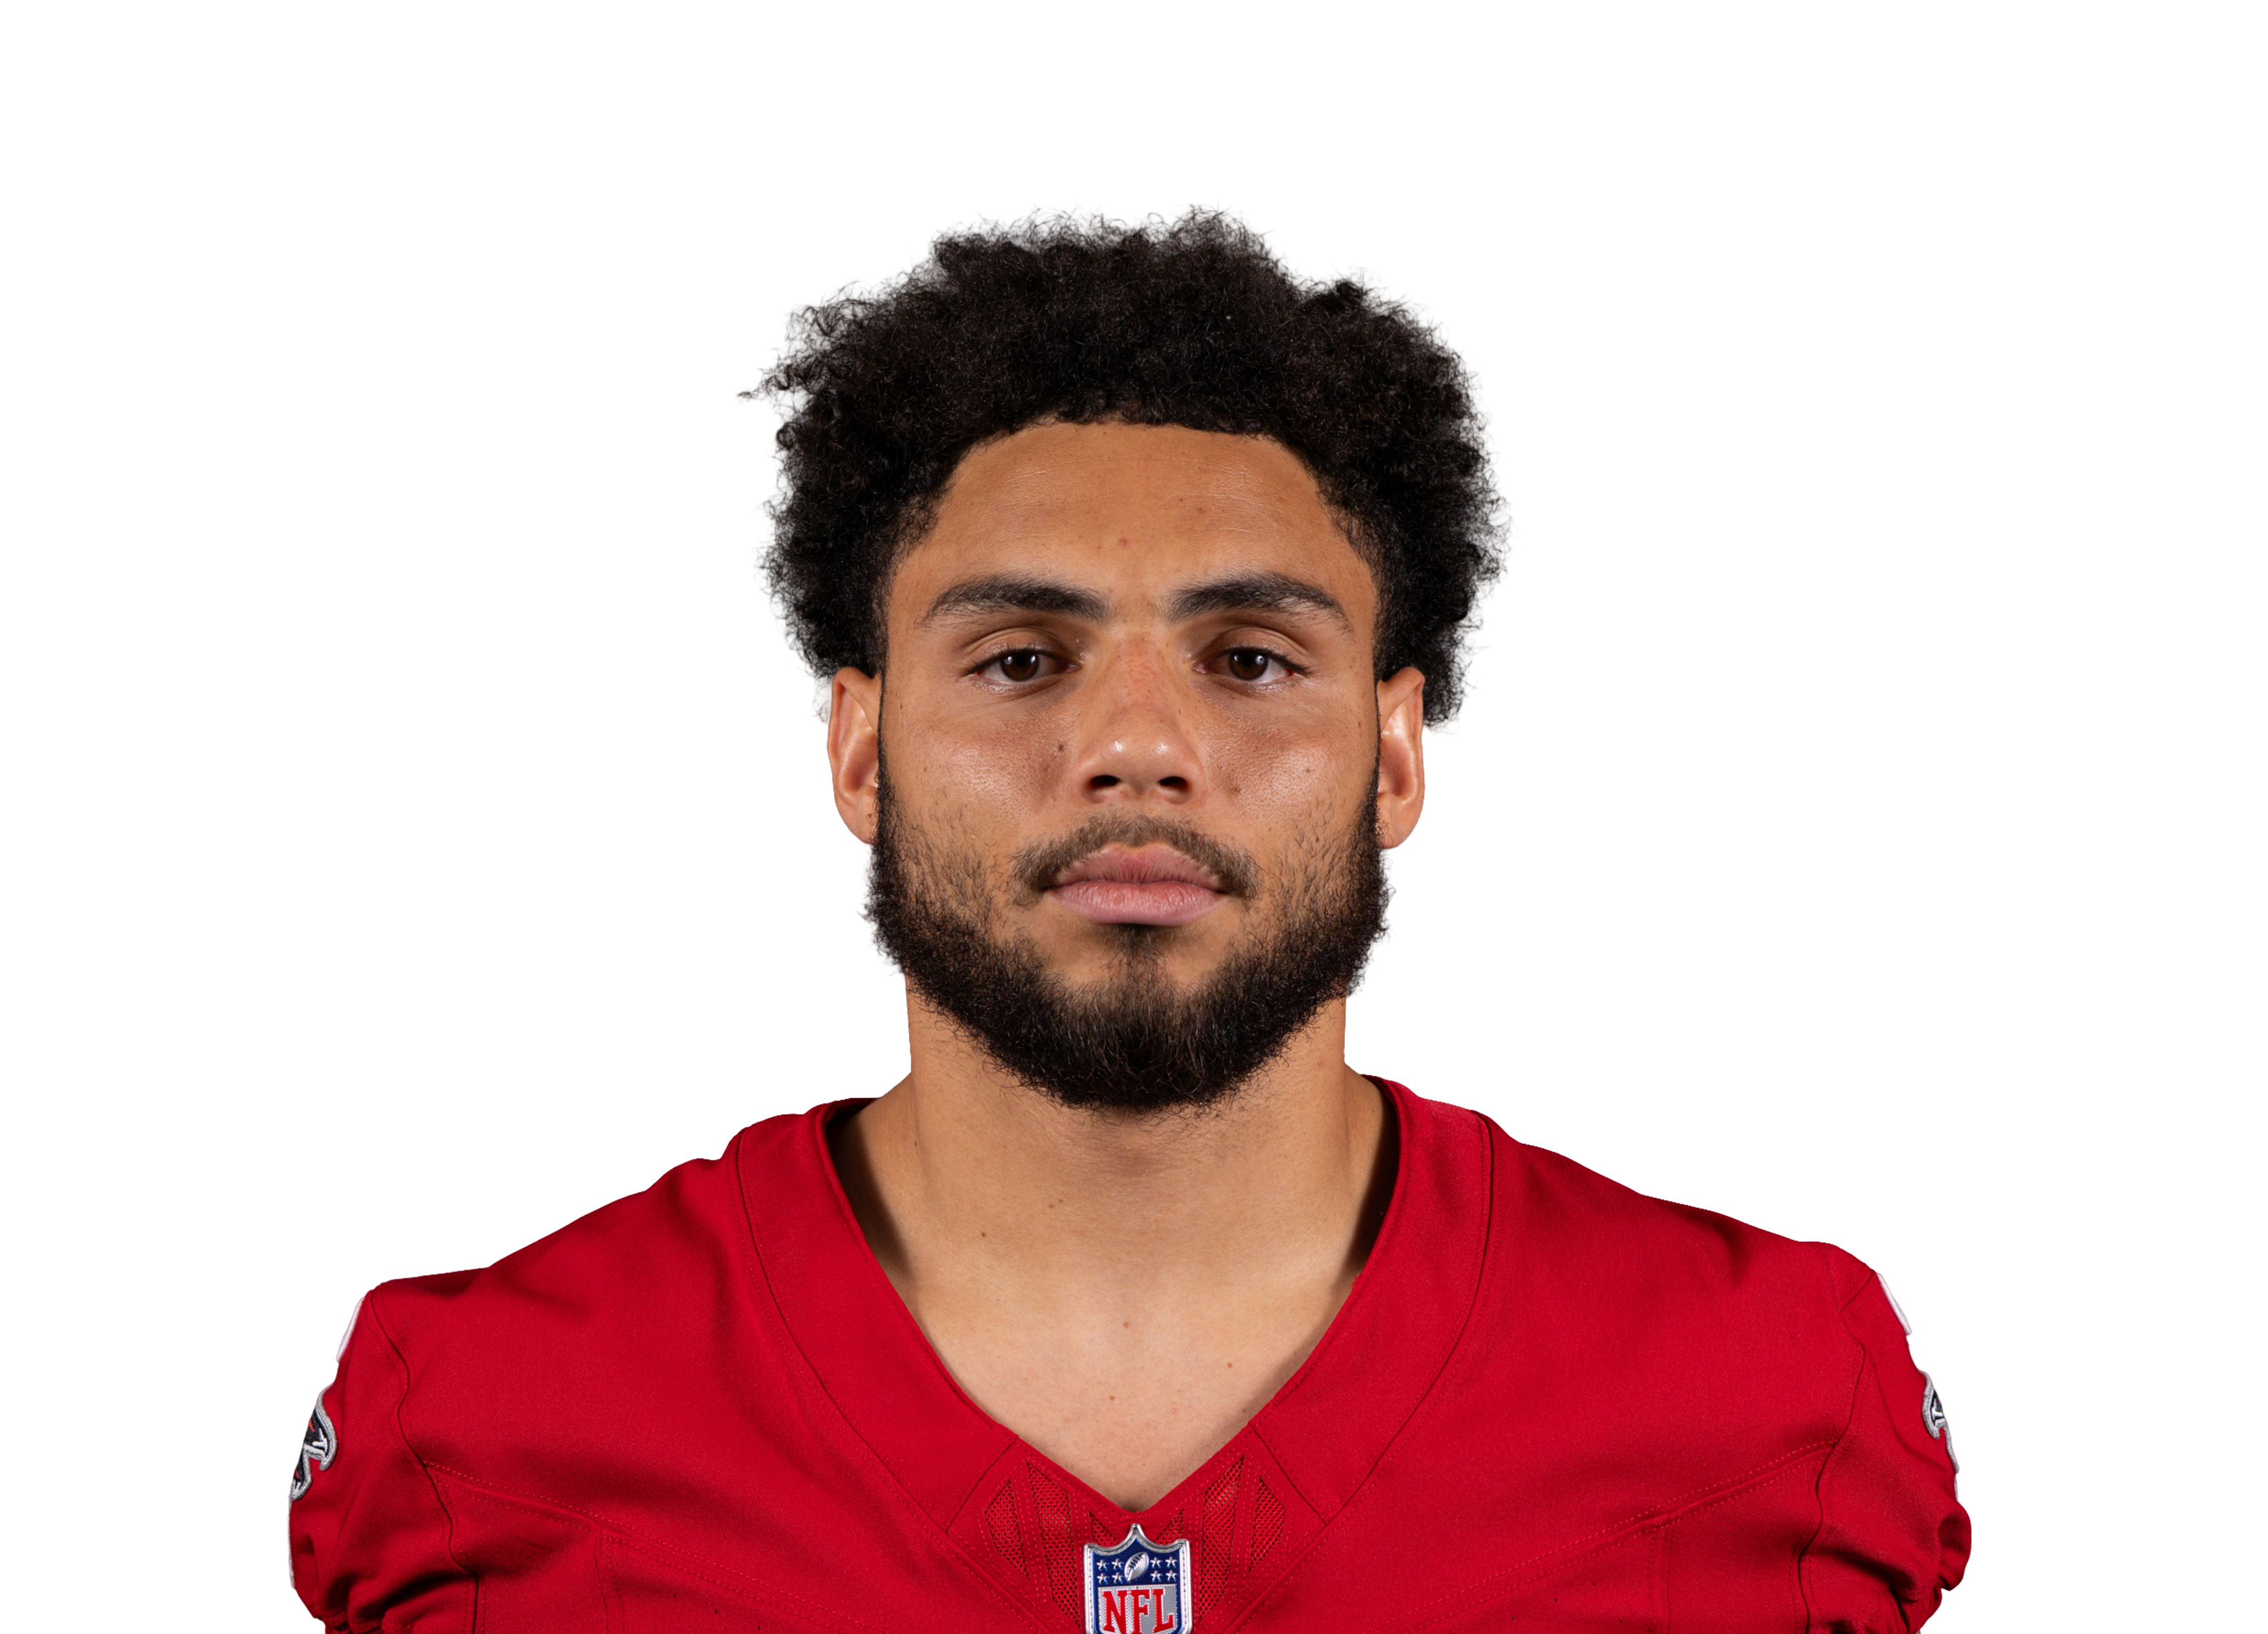
Where his targets come from
Share of his targets. The white tick is the league average.
How KC defend it
Ranked of 32, last 17 games. Green is a weakness to attack.
- Kansas City rank 25th against deep balls, and 14% of London's targets travel 20+ yards (the average WR is at 17%).
- Free data doesn't show who covers whom on each snap, so this is the defence's profile, not a confirmed one-on-one.
Unit by unit
Each unit ranked against all 32 teams on 2026 play-by-play through week 9. Longer bar is better; a gold rank marks the side with the edge.
When the Chiefs have the balloffence against defence, rank of 32 (1st is best)KC offenceATL defenceBiggest gap: rushing, where the Chiefs offence has a 19-place edge.
When the Falcons have the balloffence against defence, rank of 32 (1st is best)ATL offenceKC defenceBiggest gap: pass protection, where the Falcons offence has a 19-place edge.
Form and history
Chiefs this season 31-10wk 1 vs DENW
 33-30wk 2 vs INDW
 24-10wk 3 at MIAW
 30-27wk 4 at LVW
 22-6wk 6 vs LACL
 3-20wk 7 at SEAL24-28wk 8 at DENW
 35-12wk 9 vs NYJFalcons this season
 22-17KC at ATL
2024-09
Injury report
Chiefsmodel impact -0.7| Jimmy HolidayWR | IR |
| Jeff CaldwellWR · Knee | IR |
| Tyquan ThorntonWR · Ankle | IR |
| Brashard SmithRB · Hamstring | IR |
| John Michael GyllenborgTE · Knee | IR |
| L'Jarius SneedCB · Knee | IR |
| Ethan DownsDE · Knee - ACL | IR |
| Omarr Norman-LottDT · Knee - ACL | PUP |
| Josh SimmonsOL · Back | IR |
| Patrick MahomesQB · Elbow | Questionable |
| Xavier WorthyWR · Hamstring | Questionable |
| Jaylon MooreOL · Ankle | Questionable |
Falconsmodel impact -1.0| Trey SermonRB | IR |
| Brian Robinson Jr.RB · Hamstring | IR |
| Samson EbukamDE · Hamstring | IR |
| JD BertrandLB | IR |
| Anterio ThompsonDT | PUP |
| Da'Shawn HandDT · Quadriceps | IR |
| Cameron WilliamsOL · Ankle | IR |
| DeAngelo MaloneDL | PUP |
| Jalon WalkerDL · Knee - ACL | IR |
| Michael JerrellOT · Biceps | IR |
| Storm NortonT · Foot | PUP |
| Zachariah BranchWR · Hamstring | Doubtful |
Player props
Every posted line with the market's view and each player's last ten games against it.
| Player | Market | Line | Price | Market over | Last 10 games | Hit rate |
|---|---|---|---|---|---|---|
| Michael Penix Jr.ATL | Passing yards | 214.5 | 1.90 | 50% | 20% | |
| Patrick MahomesKC | Passing yards | 239.5 | 1.88 | 50% | 60% | |
| Michael Penix Jr.ATL | Passing TDs | 1.5 | 2.37 | 40% | 10% | |
| Patrick MahomesKC | Passing TDs | 1.5 | 1.83 | 51% | 50% | |
| Bijan RobinsonATLrole up | Rushing yards | 85.5 | 1.88 | 50% | 80% | |
| Emmett JohnsonKC | Rushing yards | 9.5 | 1.88 | 50% | 50% | |
| Kenneth Walker IIIKC | Rushing yards | 83.5 | 1.89 | 50% | 20% | |
| Khalil HerbertATLrole up | Rushing yards | 9.5 | 1.88 | 50% | 50% | |
| Michael Penix Jr.ATL | Rushing yards | 6.5 | 1.85 | 51% | 30% | |
| Patrick MahomesKCrole up | Rushing yards | 10.5 | 1.90 | 50% | 80% | |
| Bijan RobinsonATLrole up | Receiving yards | 27.5 | 1.90 | 50% | 50% | |
| Drake LondonATLrole up | Receiving yards | 71.5 | 1.90 | 50% | 40% | |
| Emmett JohnsonKC | Receiving yards | 12.5 | 1.90 | 50% | 40% | |
| Jahan DotsonATLrole up | Receiving yards | 28.5 | 1.91 | 50% | 30% | |
| Kenneth Walker IIIKC | Receiving yards | 21.5 | 1.87 | 51% | 40% | |
| Kyle PittsATLrole up | Receiving yards | 36.5 | 1.91 | 50% | 30% | |
| Noah GrayKCrole up | Receiving yards | 11.5 | 1.88 | 50% | 60% | |
| Olamide ZaccheausATLrole up | Receiving yards | 7.5 | 1.88 | 50% | 90% | |
| Rashee RiceKC | Receiving yards | 57.5 | 1.88 | 50% | 60% | |
| Travis KelceKC | Receiving yards | 48.5 | 1.91 | 50% | 40% | |
| Bijan RobinsonATLrole up | Receptions | 3.5 | 1.74 | 54% | 40% | |
| Drake LondonATLrole up | Receptions | 5.5 | 1.81 | 52% | 40% | |
| Emmett JohnsonKC | Receptions | 1.5 | 1.63 | 58% | 50% | |
| Jahan DotsonATLrole up | Receptions | 1.5 | 1.53 | 62% | 20% | |
| Kenneth Walker IIIKC | Receptions | 3.5 | 2.25 | 42% | 10% | |
| Kyle PittsATL | Receptions | 3.5 | 1.88 | 50% | 40% | |
| Noah GrayKCrole up | Receptions | 1.5 | 2.09 | 45% | 60% | |
| Olamide ZaccheausATL | Receptions | 1.5 | 2.41 | 39% | 70% | |
| Rashee RiceKC | Receptions | 5.5 | 2.12 | 45% | 70% | |
| Travis KelceKCrole up | Receptions | 4.5 | 2.04 | 46% | 60% |
"Market over" is the bookmaker's price with the margin taken out. Green bars are games that cleared the line. Our own prop model is switched off until it passes a public audit on 2026 data, so we show the market and the history, not a tip.
The betting view
Posted odds, the same odds with the bookmaker's margin removed, and where the model disagrees.
Read this before you bet: picking winners is not beating the price. At posted odds our 2025 flat-bet ROI was −6.9%. Use the model as one view of the game, not a tip.
What the model sees
Model favors KC (75%) by 7.6 points.