 WAS
 NYG
 CAR
 NO
 CLE
 JAX
 TEN
 KC
 ATL
 MIA
 IND
 GB
 ARI
 SEA
 SF
 DAL
 PIT
 CIN


This looks like a close contest, but we give a slight edge to BUF. BUF have been hot lately, winning 4 of their last 5. NYJ have been struggling, dropping 4 of their last 5.
Matchups to watch
How each player gets his production, set against how this opponent has defended it over their last 17 games. After the game we grade who won each one.
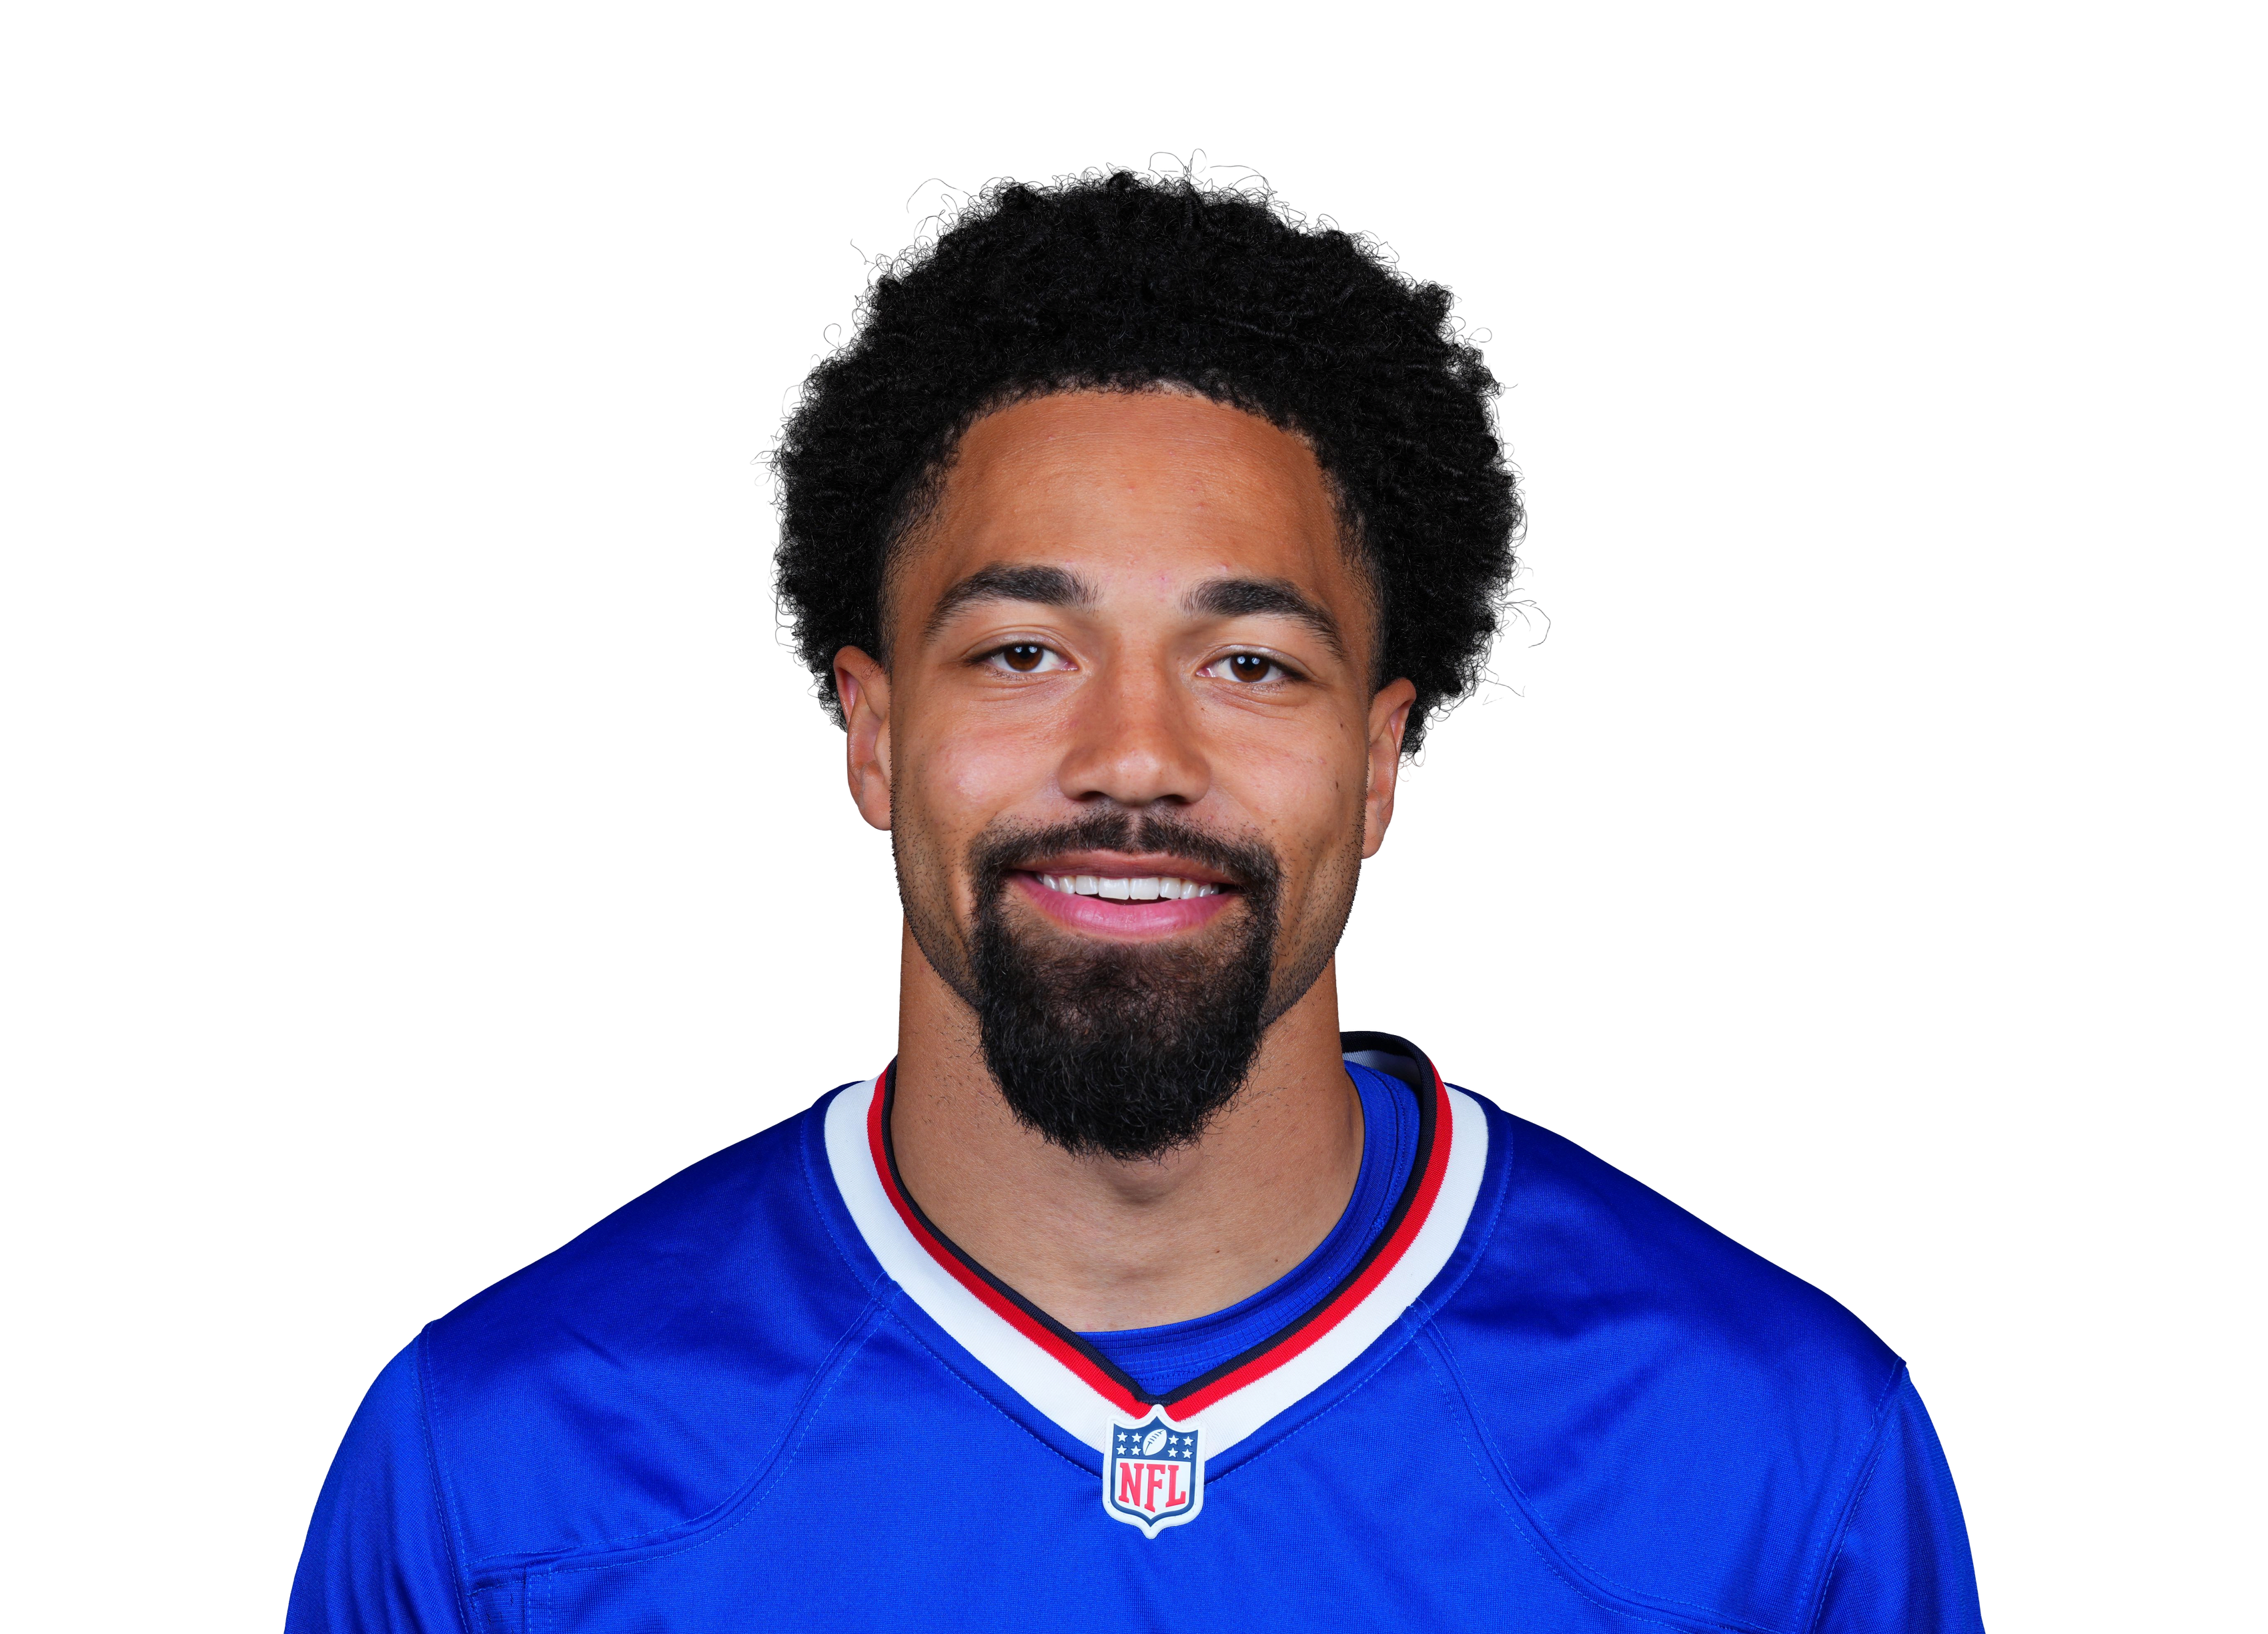
Where his targets come from
Share of his targets. The white tick is the league average.
How NYJ defend it
Ranked of 32, last 17 games. Green is a weakness to attack.
- the Jets rank 32nd against short throws and 28th for yards after the catch allowed. Shakir takes 80% of his targets short and is 71st percentile after the catch.
- Work the right side: 45% of his targets go that way and the Jets rank 32nd defending throws there.
- Free data doesn't show who covers whom on each snap, so this is the defence's profile, not a confirmed one-on-one.
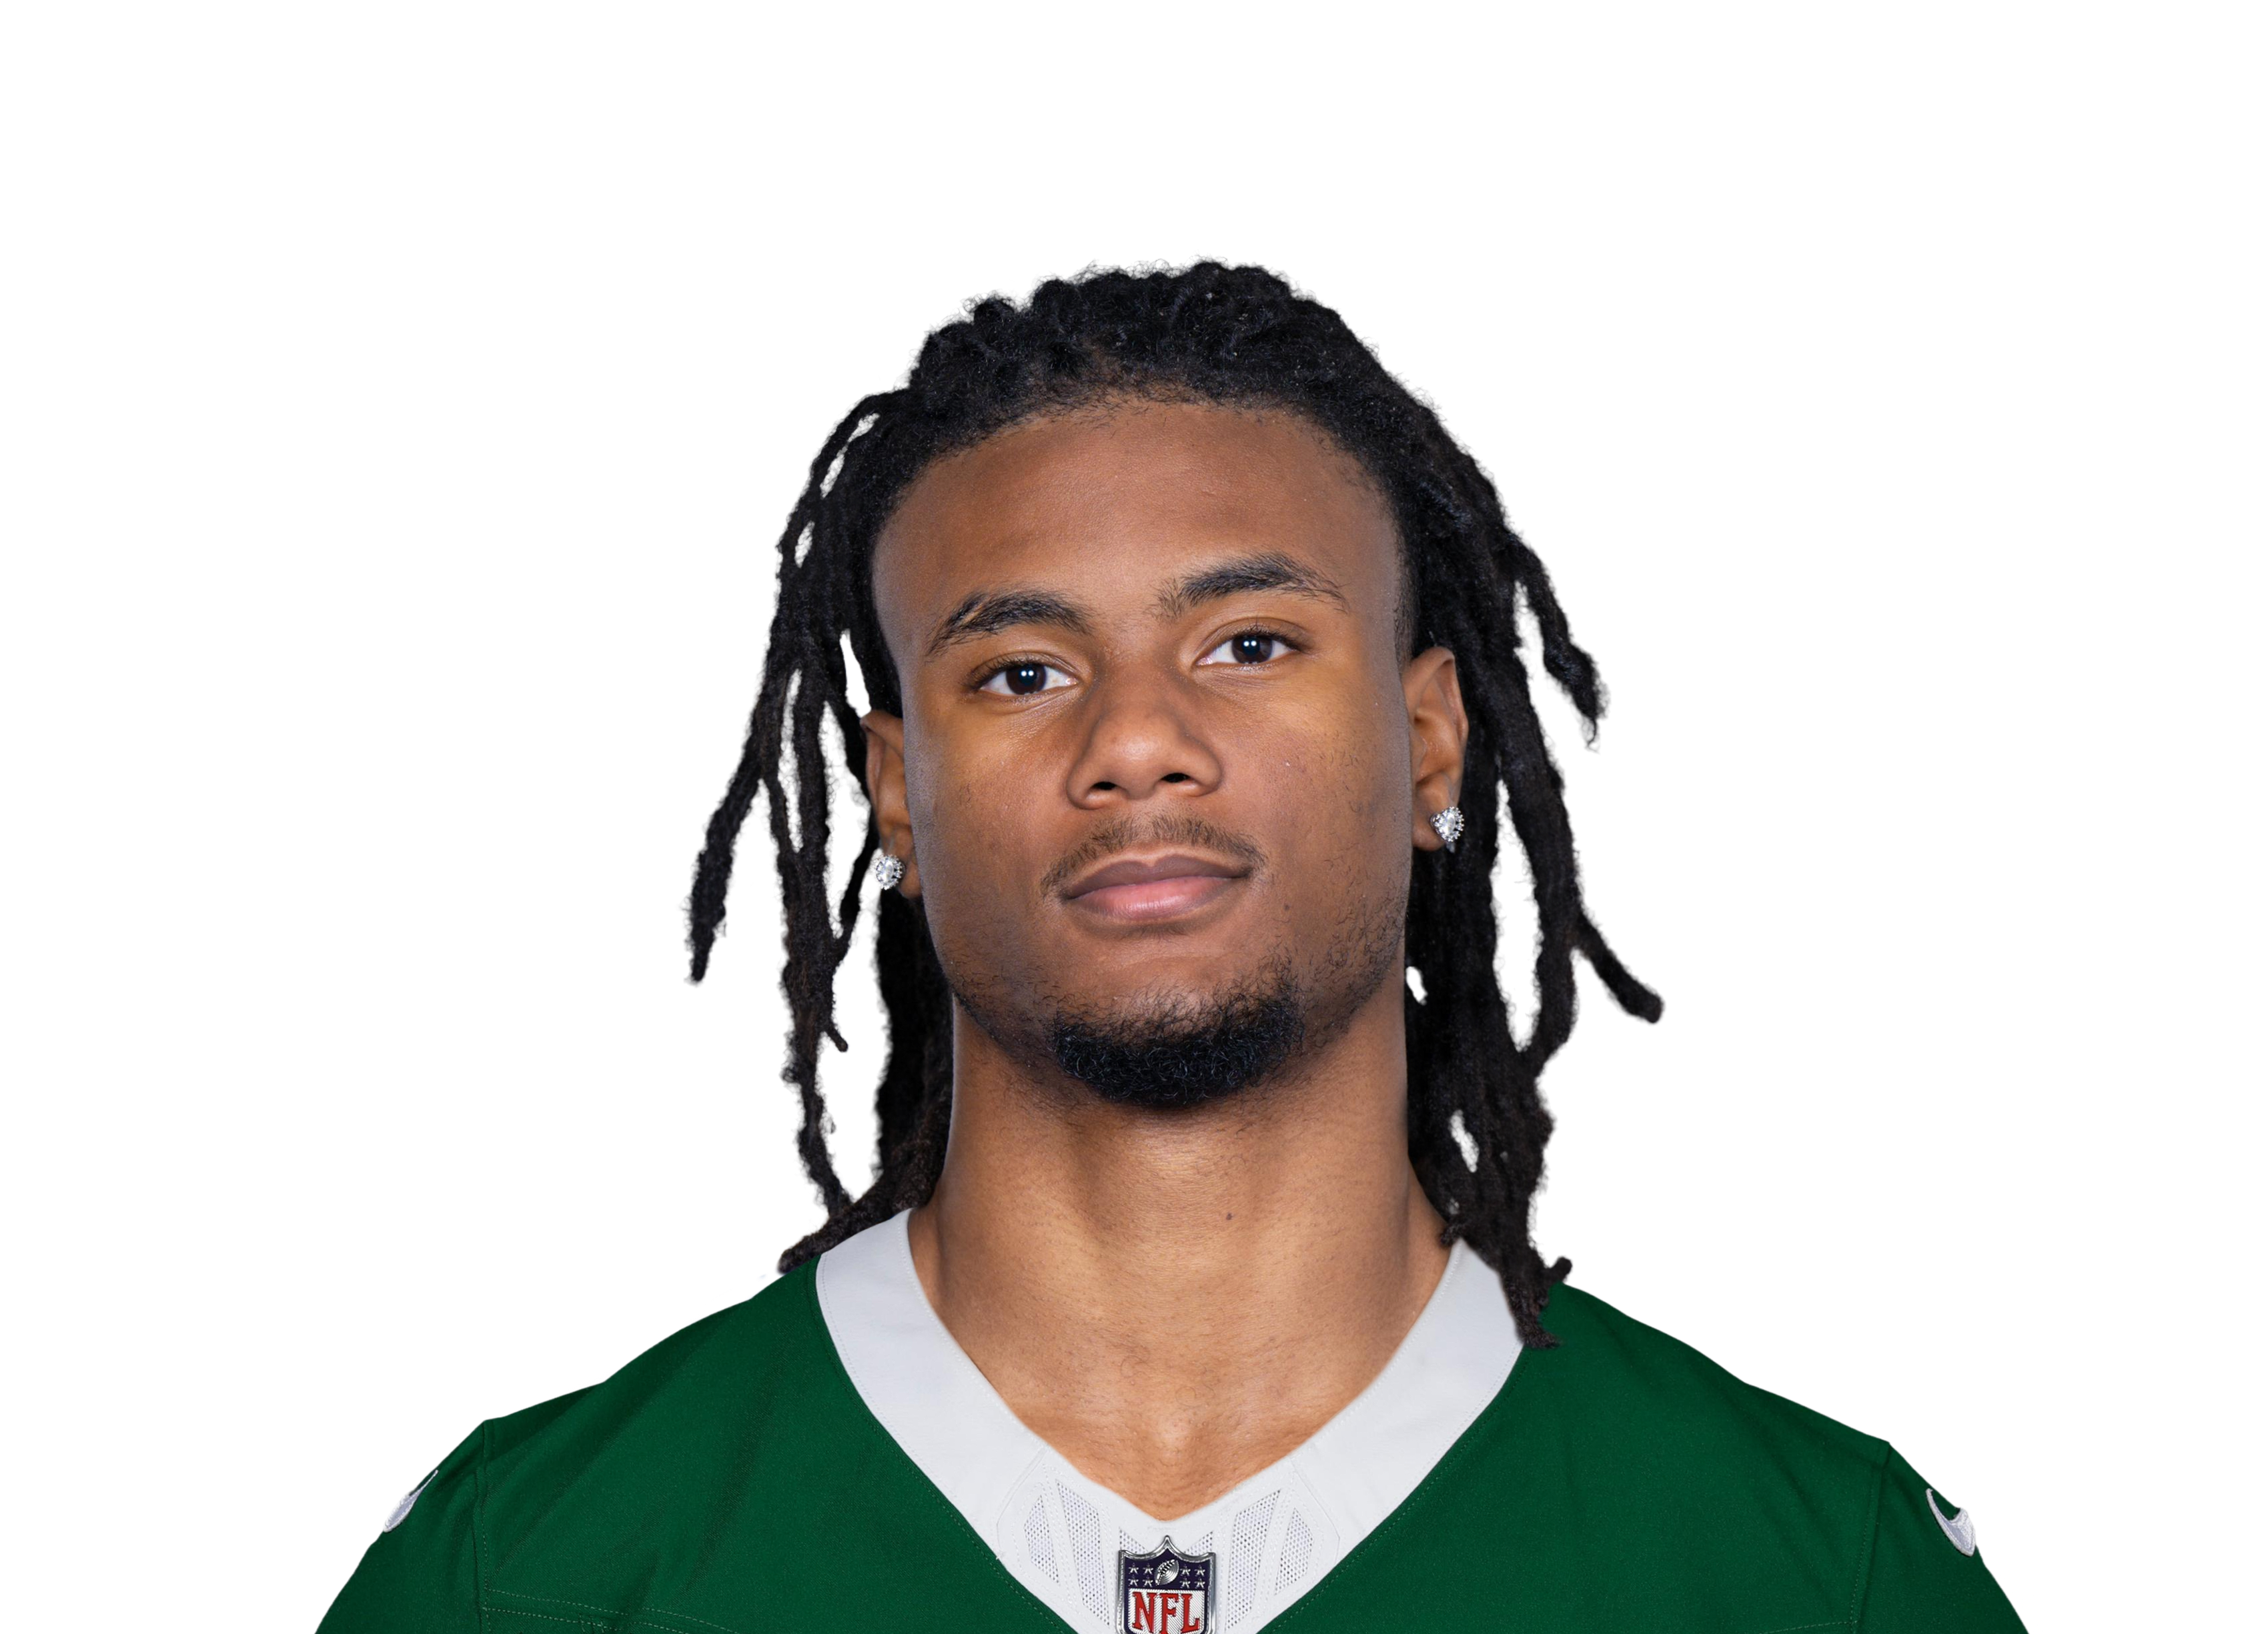
Where his targets come from
Share of his targets. The white tick is the league average.
How BUF defend it
Ranked of 32, last 17 games. Green is a weakness to attack.
- Buffalo rank 17th against intermediate throws, which make up 27% of Mitchell's targets.
- Don't force short throws: they've been Mitchell's worst return (-0.25 EPA a target), and Buffalo are 8th there.
- Contested catches aren't his edge this week: he's 33rd percentile for separation and 37th for hands, and Christian Benford, Maxwell Hairston, Davison Igbinosun and Taron Johnson all allow fewer yards per target than the average corner (7.4).
- Free data doesn't show who covers whom on each snap, so this is the defence's profile, not a confirmed one-on-one.
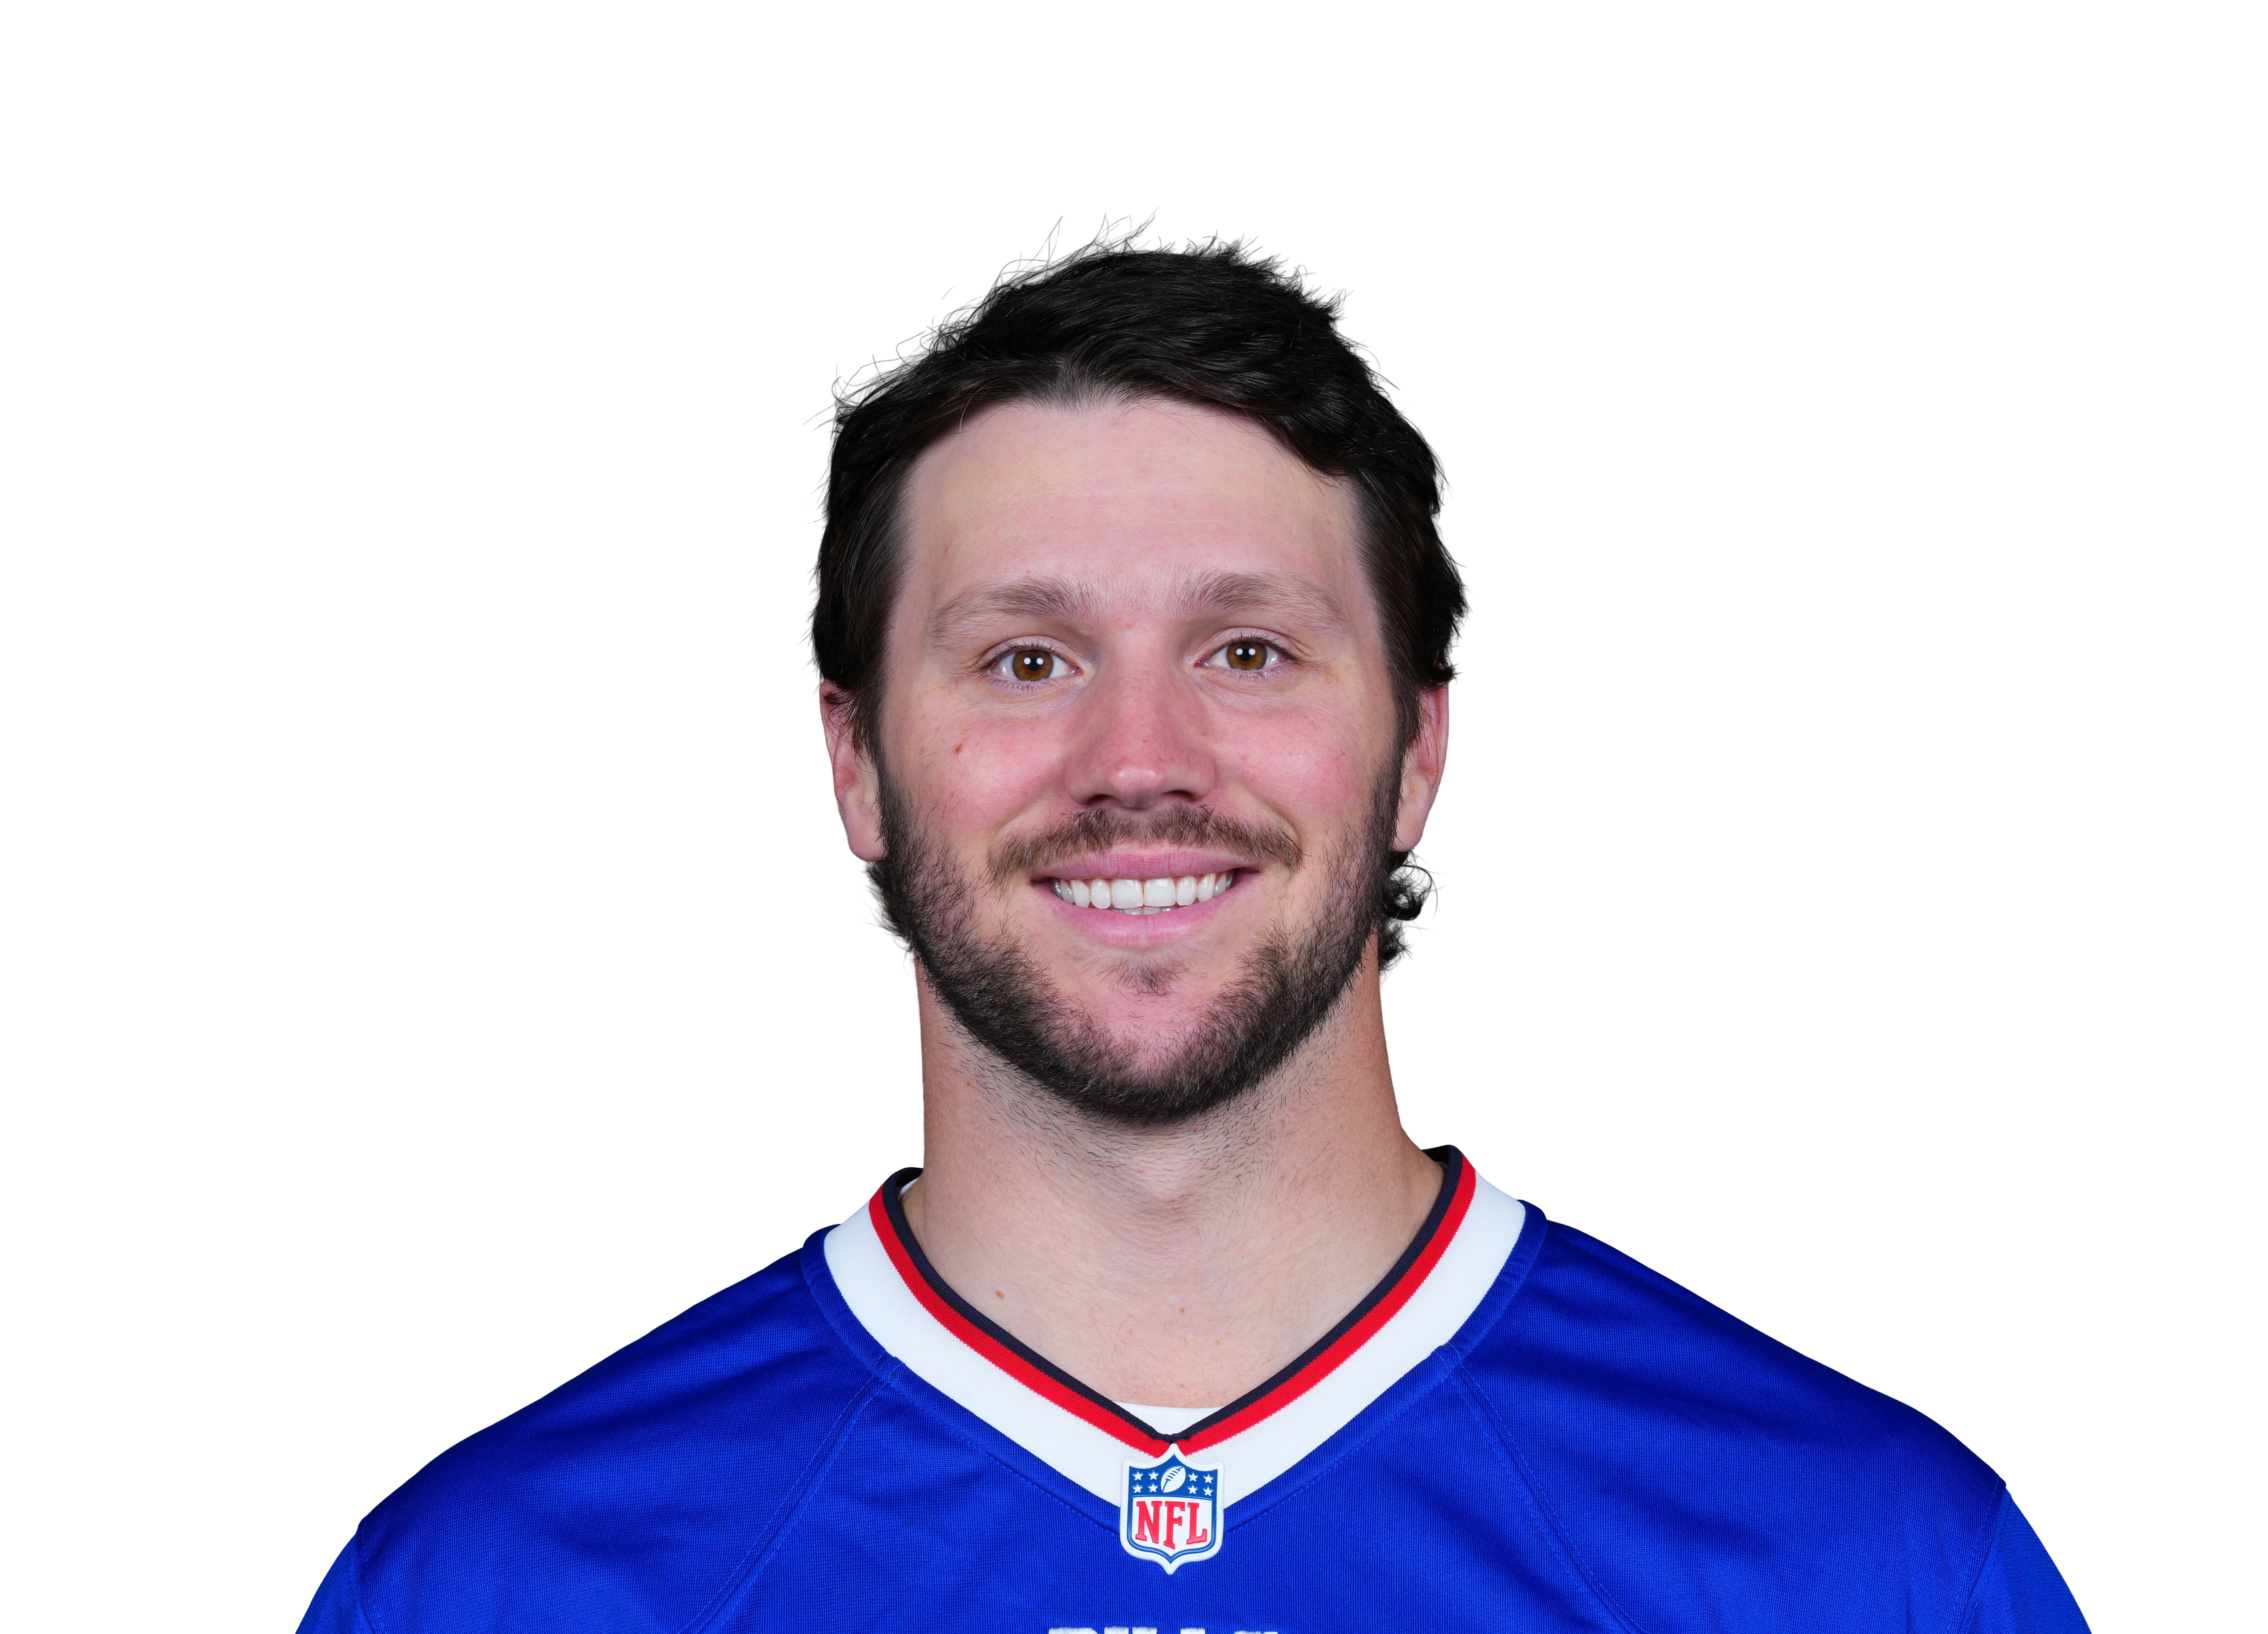
How NYJ defend it
Ranked of 32, last 17 games. Green is a weakness to attack.
- the Jets rank 32nd in EPA per dropback allowed over their last 17 games, and 32nd against short throws.
- Pressure: the Jets are 26th at getting sacks, and Buffalo are 21st at avoiding them.
Unit by unit
Each unit ranked against all 32 teams on 2026 play-by-play through week 9. Longer bar is better; a gold rank marks the side with the edge.
When the Bills have the balloffence against defence, rank of 32 (1st is best)BUF offenceNYJ defenceBiggest gap: passing, where the Bills offence has a 22-place edge.
When the Jets have the balloffence against defence, rank of 32 (1st is best)NYJ offenceBUF defenceBiggest gap: third down, where the Bills defence has a 12-place edge.
Form and history
Bills this season 36-31wk 1 at HOUW
 41-31wk 2 vs DETW
 24-16wk 3 vs LACL
 26-29wk 4 vs NEW
 37-34wk 5 at LAW
 33-30wk 6 at LVW
 36-10wk 8 vs BALW
 23-6wk 9 at MINJets this season
 8-35NYJ at BUF
2026-01
30-10BUF at NYJ2025-09
14-40NYJ at BUF2024-12
23-20BUF at NYJ2024-10
6-32NYJ at BUF2023-11
Injury report
Billsmodel impact 0.0| Joshua PalmerWR · Hamstring | IR |
| Tyrell ShaversWR · Knee - ACL | PUP |
| Dorian StrongCB · Neck | PUP |
| Zane DurantDT | IR |
| Jordan HancockDB · Hamstring | IR |
| Greg GainesDT · Calf | Questionable |
| Alec AndersonOL · Ankle | Questionable |
| Dion DawkinsOT · Ribs | Questionable |
Jetsmodel impact 0.0| Arian SmithWR · Knee | IR |
| Tyler BaronDE · Knee | PUP |
| Braiden McGregorDE · Pectoral | IR |
| Marcelino McCrary-BallLB · Ankle | IR |
| Kiko MauigoaLB · Quadriceps | IR |
| Kingsley JonathanDT · Thigh | IR |
| David OnyemataDT · Groin | IR |
| VJ PayneDB | IR |
| Max MitchellT · Concussion | IR |
| T'Vondre SweatDL · Knee | IR |
| Anez CooperG · Shoulder | IR |
| Garrett WilsonWR · Concussion | Questionable |
Player props
Every posted line with the market's view and each player's last ten games against it.
| Player | Market | Line | Price | Market over | Last 10 games | Hit rate |
|---|---|---|---|---|---|---|
| Geno SmithNYJ | Passing yards | 220.5 | 1.89 | 50% | 60% | |
| Josh AllenBUF | Passing yards | 228.5 | 1.88 | 50% | 60% | |
| Geno SmithNYJrole up | Passing TDs | 1.5 | 2.47 | 38% | 30% | |
| Josh AllenBUF | Passing TDs | 1.5 | 1.76 | 54% | 60% | |
| Breece HallNYJ | Rushing yards | 56.5 | 1.91 | 50% | 50% | |
| James CookNYJrole up | Rushing yards | 91.5 | 1.88 | 50% | 40% | |
| Josh AllenBUFrole up | Rushing yards | 28.5 | 1.87 | 51% | 70% | |
| Breece HallNYJrole up | Receiving yards | 17.5 | 1.91 | 49% | 50% | |
| Dalton KincaidBUFrole up | Receiving yards | 41.5 | 1.88 | 50% | 30% | |
| DJ MooreBUF | Receiving yards | 47.5 | 1.88 | 50% | 80% | |
| Garrett WilsonNYJ | Receiving yards | 63.5 | 1.91 | 50% | 40% | |
| James CookNYJ | Receiving yards | 8.5 | 1.86 | 51% | 60% | |
| Khalil ShakirBUF | Receiving yards | 41.5 | 1.91 | 50% | 60% | |
| Breece HallNYJ | Receptions | 2.5 | 2.15 | 44% | 50% | |
| Dalton KincaidBUFrole up | Receptions | 3.5 | 1.88 | 50% | 40% | |
| DJ MooreBUF | Receptions | 3.5 | 1.81 | 52% | 80% | |
| Garrett WilsonNYJ | Receptions | 5.5 | 1.93 | 49% | 40% | |
| James CookNYJ | Receptions | 1.5 | 1.82 | 52% | 50% | |
| Khalil ShakirBUF | Receptions | 3.5 | 1.71 | 55% | 80% |
"Market over" is the bookmaker's price with the margin taken out. Green bars are games that cleared the line. Our own prop model is switched off until it passes a public audit on 2026 data, so we show the market and the history, not a tip.
The betting view
Posted odds, the same odds with the bookmaker's margin removed, and where the model disagrees.
Read this before you bet: picking winners is not beating the price. At posted odds our 2025 flat-bet ROI was −6.9%. Use the model as one view of the game, not a tip.
What the model sees
Model favors BUF (69%) by 7.5 points.