 NE
 DET
 BUF
 NYJ
 CAR
 NO
 HOU
 CLE
 JAX
 TEN
 KC
 ATL
 MIA
 MIN
 GB
 ARI
 LV
 PIT
 CIN
 LAC
 BAL


NYG look like the play here. WAS have struggled recently, losing 4 of their last 5.
Matchups to watch
How each player gets his production, set against how this opponent has defended it over their last 17 games. After the game we grade who won each one.
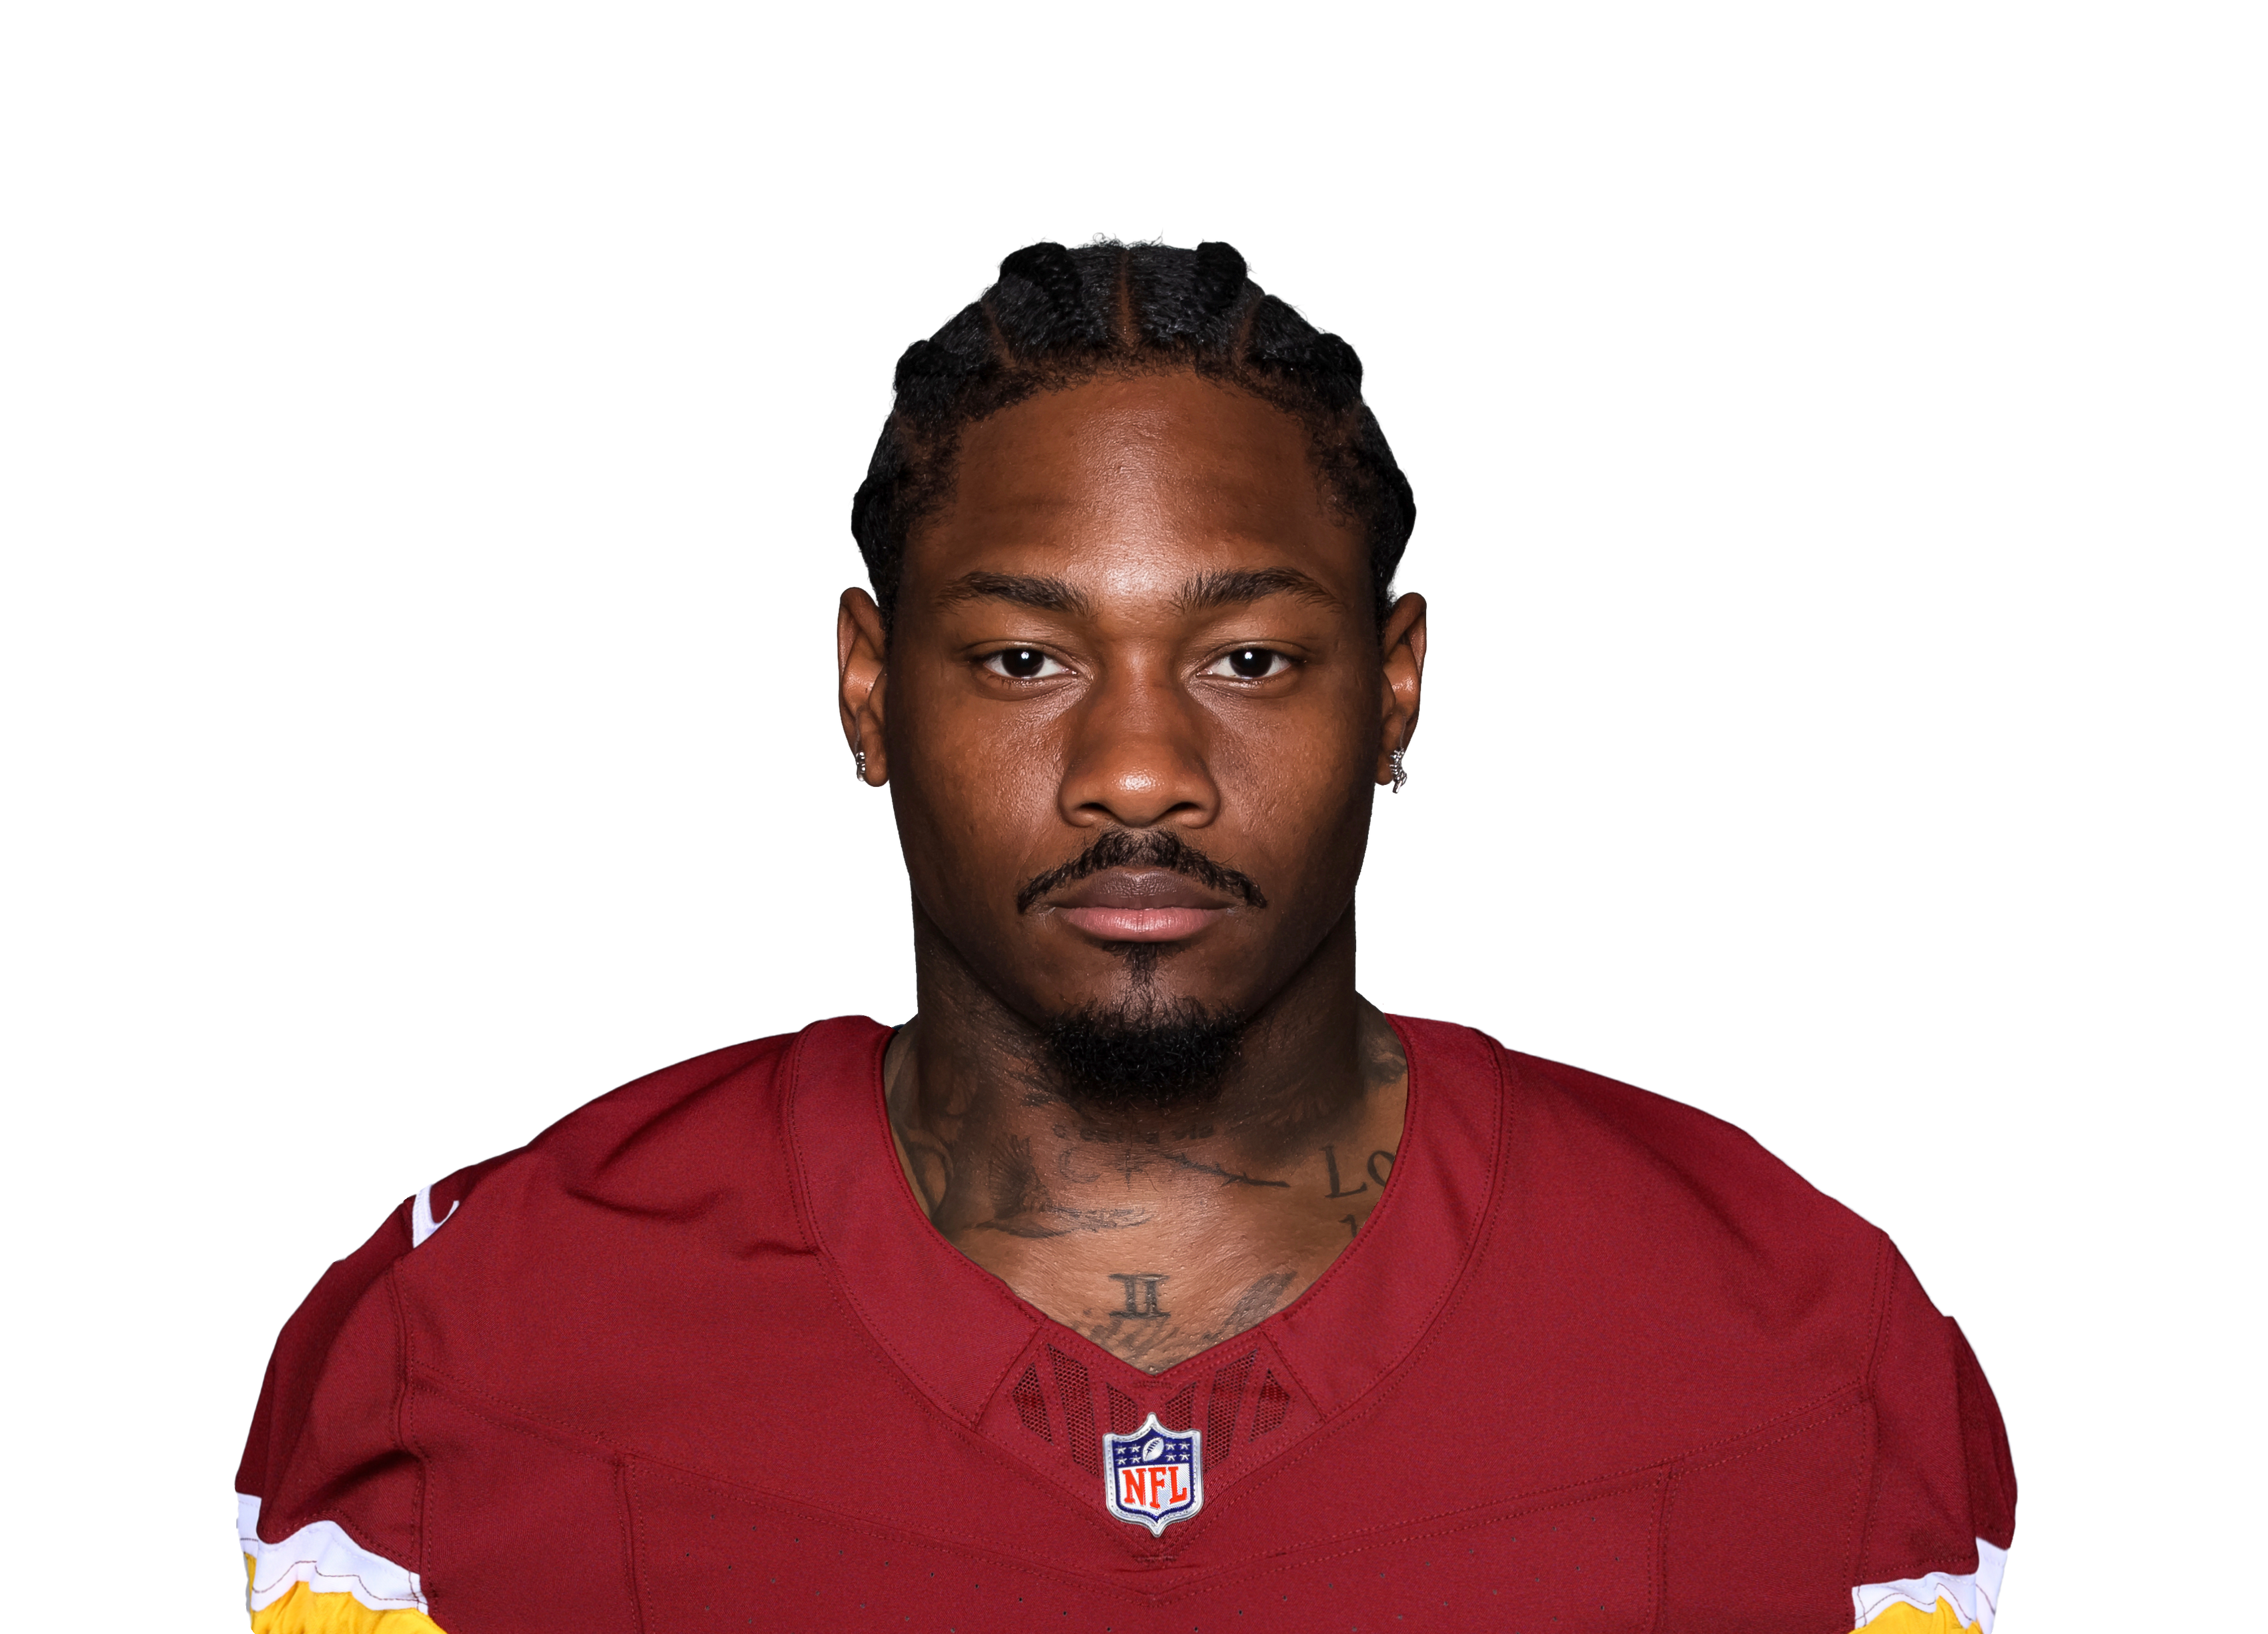
Where his targets come from
Share of his targets. The white tick is the league average.
How NYG defend it
Ranked of 32, last 17 games. Green is a weakness to attack.
- the Giants are mid-table or better at every depth over their last 17 games. Diggs's likeliest route is short throws (71% of his targets), where they rank 16th.
- Work the middle: 31% of his targets go that way and the Giants rank 24th defending throws there.
- Contested catches aren't his edge this week: he's 57th percentile for separation and 18th for hands, and Deonte Banks and Andru Phillips both allow fewer yards per target than the average corner (7.4).
- Free data doesn't show who covers whom on each snap, so this is the defence's profile, not a confirmed one-on-one.
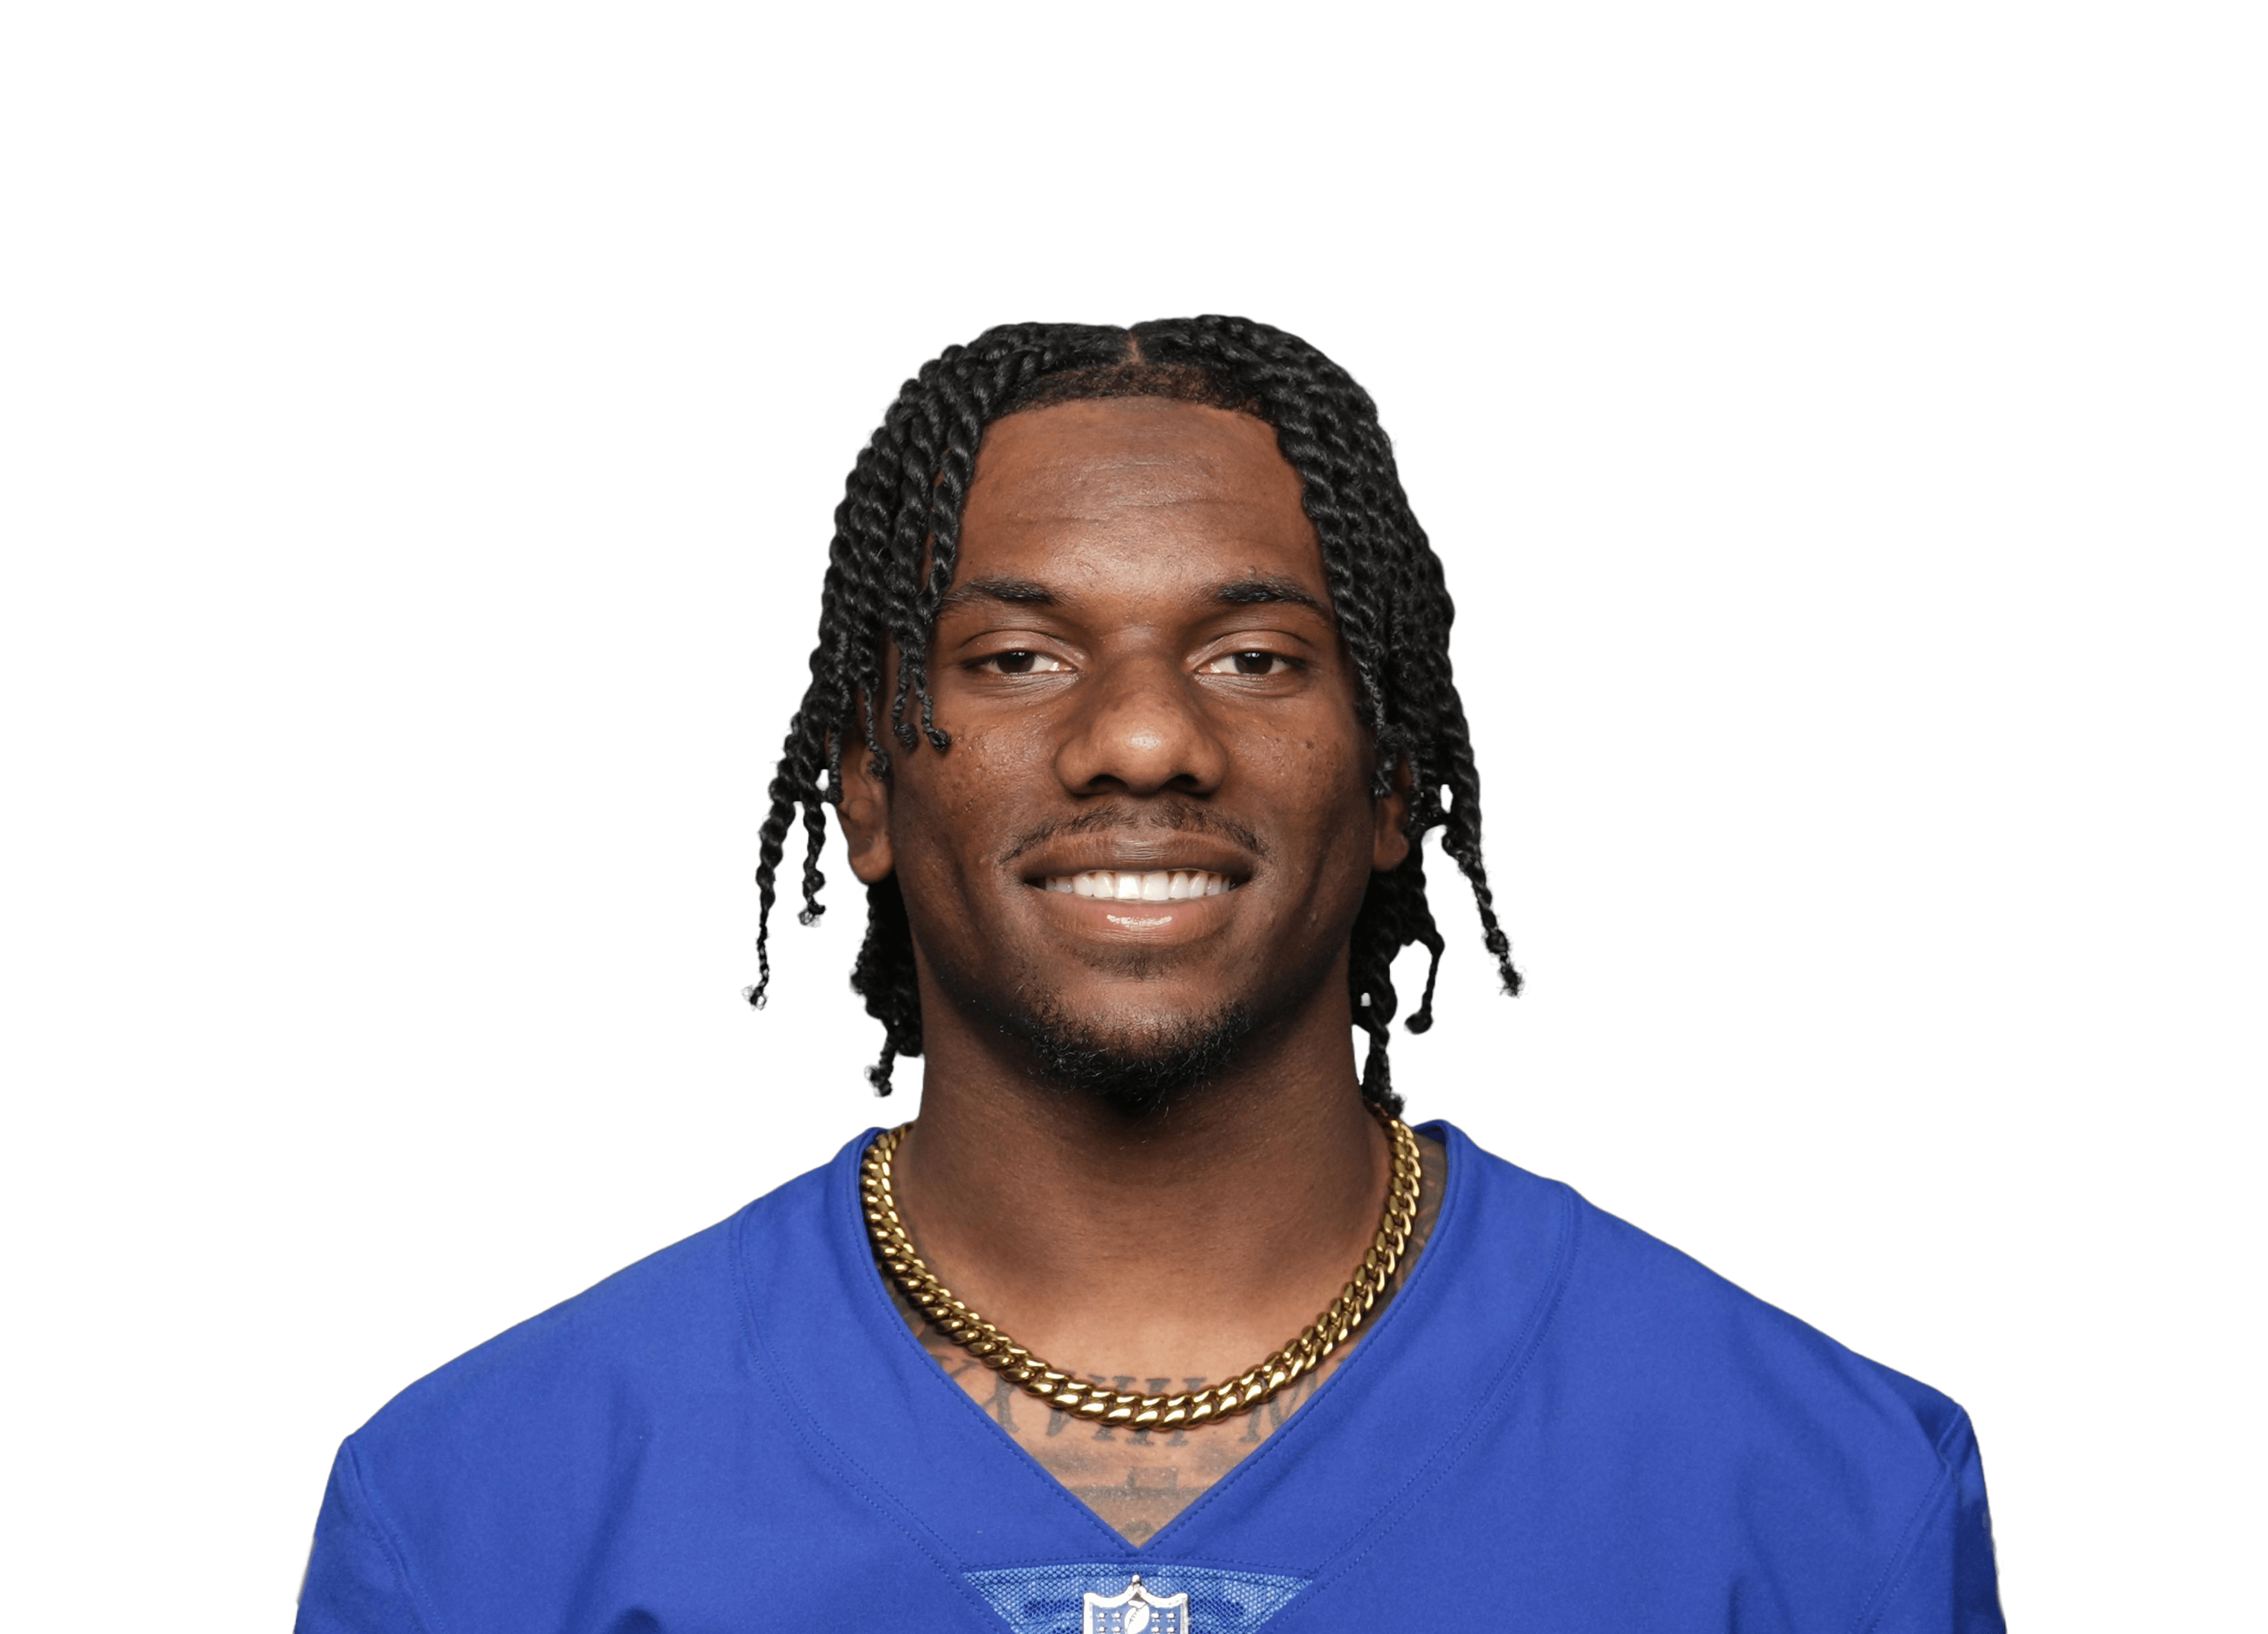
Where his targets come from
Share of his targets. The white tick is the league average.
How WAS defend it
Ranked of 32, last 17 games. Green is a weakness to attack.
- Washington rank 20th against deep balls, and 23% of Nabers's targets travel 20+ yards (the average WR is at 17%).
- Work the right side: 40% of his targets go that way and Washington rank 28th defending throws there.
- Free data doesn't show who covers whom on each snap, so this is the defence's profile, not a confirmed one-on-one.
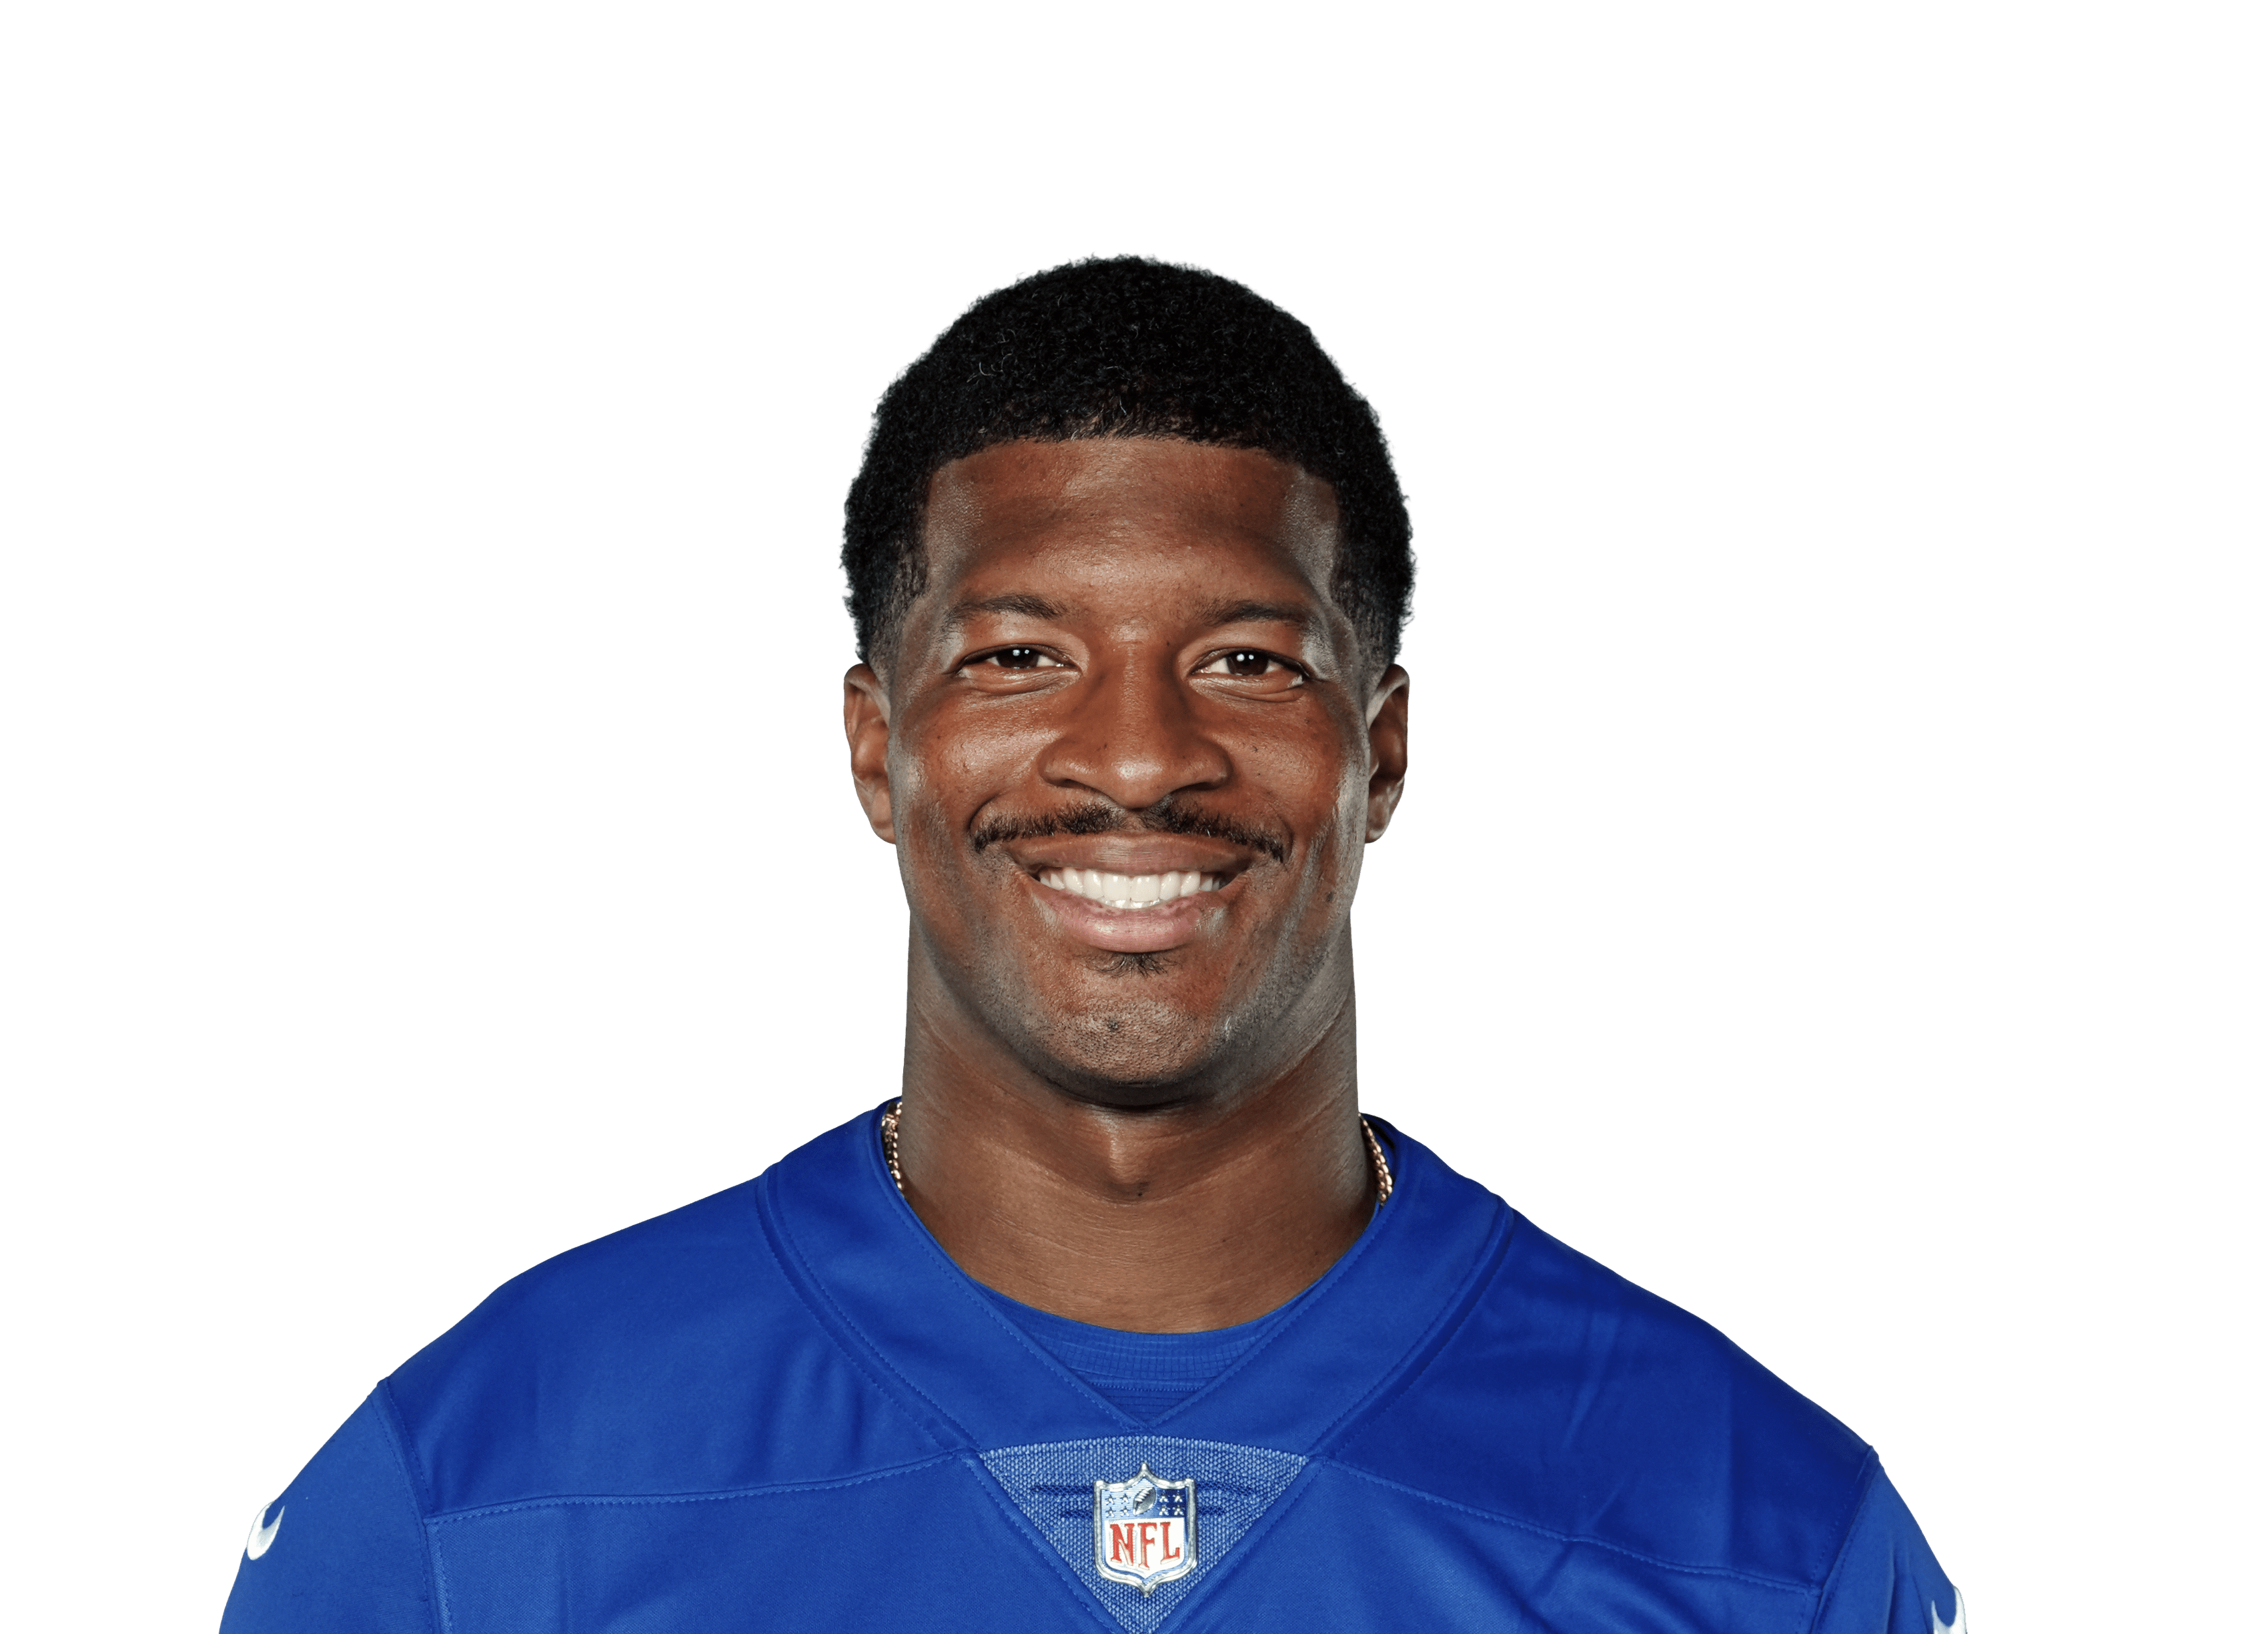
How WAS defend it
Ranked of 32, last 17 games. Green is a weakness to attack.
- Washington rank 28th in EPA per dropback allowed over their last 17 games, and 29th against intermediate throws.
- Pressure: Washington are 22nd at getting sacks, and the Giants are 26th at avoiding them.
Unit by unit
Each unit ranked against all 32 teams on 2026 play-by-play through week 9. Longer bar is better; a gold rank marks the side with the edge.
When the Commanders have the balloffence against defence, rank of 32 (1st is best)WAS offenceNYG defenceBiggest gap: third down, where the Giants defence has a 20-place edge.
When the Giants have the balloffence against defence, rank of 32 (1st is best)NYG offenceWAS defenceBiggest gap: third down, where the Giants offence has a 7-place edge.
Form and history
Commanders this season 22-24wk 1 at PHIL
 20-37wk 2 at DALW
 33-31wk 3 vs SEAL
 13-30wk 4 vs INDT27-27wk 5 vs NYGL
 17-23wk 6 at SFW27-10wk 8 vs PHIL
 13-20wk 9 vs LAGiants this season27-27NYG at WAS
2026-10
29-21WAS at NYG2025-12
6-21NYG at WAS2025-09
27-22WAS at NYG2024-11
18-21NYG at WAS2024-09
Injury report
Commandersmodel impact 0.0| Dyami BrownWR · Calf | IR |
| Jaylin LaneWR · Ankle | IR |
| Terry McLaurinWR · Knee | IR |
| Jeremy McNicholsRB · Foot | IR |
| Jacory Croskey-MerrittRB · Groin | IR |
| Leo ChenalLB · Neck | IR |
| Javon KinlawDT · Knee | IR |
| Daron PayneDT · Foot | IR |
| Laremy TunsilOL · Triceps | IR |
| Javontae Jean-BaptisteDL · Pectoral | IR |
| Lucas PatrickG · Concussion | Doubtful |
| Treylon BurksWR · Foot | Questionable |
Giantsmodel impact 0.0| Jaxson DartQB · Knee - Meniscus | IR |
| Braxton BerriosWR · Foot | IR |
| Calvin Austin IIIWR · Knee | IR |
| Gunner OlszewskiWR · Achilles | IR |
| Tyrone Tracy Jr.RB · Hamstring | IR |
| Thaddeus DixonCB · Achilles | IR |
| Jarrick Bernard-ConverseCB · Knee | IR |
| Korie BlackCB | IR |
| Roy Robertson-HarrisDE · Achilles | IR |
| Chauncey GolstonDE · Neck | IR |
| Brian BurnsDE · Knee - ACL | IR |
| Tremaine EdmundsLB · Chest | IR |
Player props
Every posted line with the market's view and each player's last ten games against it.
| Player | Market | Line | Price | Market over | Last 10 games | Hit rate |
|---|---|---|---|---|---|---|
| J.J. McCarthyNYG | Passing yards | 210.5 | 1.90 | 50% | 0% | |
| Jayden DanielsWAS | Passing yards | 200.5 | 1.89 | 50% | 80% | |
| J.J. McCarthyNYG | Passing TDs | 1.5 | 2.61 | 36% | 0% | |
| Jayden DanielsWASrole up | Passing TDs | 1.5 | 2.67 | 35% | 70% | |
| Austin EkelerWAS | Rushing yards | 27.5 | 1.92 | 49% | 40% | |
| Cam SkatteboNYG | Rushing yards | 50.5 | 1.87 | 51% | 10% | |
| Devin SingletaryNYGrole up | Rushing yards | 23.5 | 1.87 | 51% | 30% | |
| J.J. McCarthyNYG | Rushing yards | 18.5 | 1.88 | 50% | 25% | |
| Jayden DanielsWAS | Rushing yards | 35.5 | 1.91 | 50% | 70% | |
| Rachaad WhiteWASrole up | Rushing yards | 38.5 | 1.88 | 50% | 30% | |
| Antonio WilliamsWAS | Receiving yards | 39.5 | 1.89 | 50% | 0% | |
| Austin EkelerWAS | Receiving yards | 8.5 | 1.93 | 49% | 60% | |
| Cam SkatteboNYG | Receiving yards | 7.5 | 1.96 | 48% | 30% | |
| Chig OkonkwoWAS | Receiving yards | 35.5 | 1.87 | 51% | 60% | |
| Darnell MooneyNYGrole up | Receiving yards | 15.5 | 1.89 | 50% | 90% | |
| Devin SingletaryNYGrole up | Receiving yards | 8.5 | 1.85 | 51% | 30% | |
| Isaiah LikelyNYGrole up | Receiving yards | 45.5 | 1.88 | 50% | 40% | |
| Malachi FieldsNYG | Receiving yards | 26.5 | 1.88 | 50% | 0% | |
| Malik NabersNYG | Receiving yards | 66.5 | 1.88 | 50% | 60% | |
| Rachaad WhiteWAS | Receiving yards | 13.5 | 1.88 | 50% | 70% | |
| Stefon DiggsWAS | Receiving yards | 41.5 | 1.92 | 49% | 60% | |
| Theo JohnsonNYGrole up | Receiving yards | 4.5 | 1.88 | 50% | 100% | |
| Van JeffersonWAS | Receiving yards | 13.5 | 1.89 | 49% | 50% | |
| Antonio WilliamsWAS | Receptions | 3.5 | 1.71 | 55% | 10% | |
| Austin EkelerWASrole up | Receptions | 1.5 | 2.02 | 47% | 90% | |
| Cam SkatteboNYG | Receptions | 1.5 | 2.28 | 41% | 30% | |
| Chig OkonkwoWAS | Receptions | 3.5 | 1.61 | 59% | 30% | |
| Darnell MooneyNYGrole up | Receptions | 1.5 | 1.91 | 49% | 90% | |
| Devin SingletaryNYGrole up | Receptions | 1.5 | 2.16 | 44% | 30% | |
| Isaiah LikelyNYG | Receptions | 4.5 | 1.81 | 52% | 10% | |
| Malachi FieldsNYG | Receptions | 2.5 | 2.19 | 43% | 0% | |
| Malik NabersNYG | Receptions | 5.5 | 1.78 | 53% | 80% | |
| Rachaad WhiteWAS | Receptions | 2.5 | 2.16 | 44% | 40% | |
| Stefon DiggsWAS | Receptions | 4.5 | 2.23 | 42% | 80% | |
| Theo JohnsonNYGrole up | Receptions | 0.5 | 1.60 | 59% | 100% | |
| Van JeffersonWAS | Receptions | 1.5 | 1.83 | 55% | 40% |
"Market over" is the bookmaker's price with the margin taken out. Green bars are games that cleared the line. Our own prop model is switched off until it passes a public audit on 2026 data, so we show the market and the history, not a tip.
The betting view
Posted odds, the same odds with the bookmaker's margin removed, and where the model disagrees.
Read this before you bet: picking winners is not beating the price. At posted odds our 2025 flat-bet ROI was −6.9%. Use the model as one view of the game, not a tip.
What the model sees
Model favors NYG (66%) by 5.6 points.